Price formations
The price chart reflects the fluctuations of investors’ levels of optimism over time. Looking at their ups and downs, we can say something about what they think and feel. And thus something about what they will do next.
Certain patterns, called price formations, can be explained by precise descriptions of the investors’ psychological state. When these patterns are formed in price charts, clear buy or sell signals are triggered. Identification of and trading from price formations are very central to technical analysis.
Investtech has created computer programmes that identify formations and plot them in charts. Buy signals are shown as green arrows and sell signals as red arrows. The height of the arrows denotes expected price movement.
Main principles
- Buy stocks that have triggered buy signals from price formations.
- Sell stocks that have triggered sell signals from price formations.
Top formations
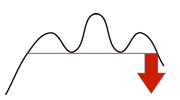
Head and shoulders formation
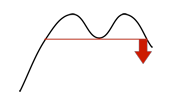
Double top formation
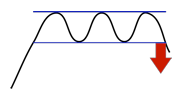
Rectangle formation
- Warn that a rising trend is over and that a falling trend begins
- Sell!
Bottom formations
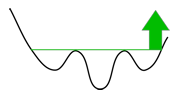
Inverse head and shoulder formation
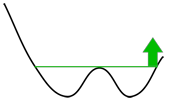
Double bottom formation
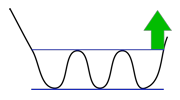
Rectangle formation
- Warn that a falling trend is over and that a rising trend begins
- Buy!
Continuing formations
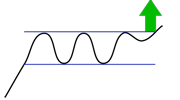
Rectangle formation buy
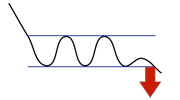
Rectangle formation sell
- Warn that a consolidation is over.
- May trigger a buy signal that says a rising trend will continue up.
- May trigger a sell signal that says a falling trend will continue to fall.
Important details
- The strength of a price movement is described by its volume. Increasing volume strengthens the signal from a formation. A volume reduction often indicates it was a false signal.
- The price often moves significantly immediately after a break. Ideally one should therefore act quickly following a break. However the price will often fall again a little later, so a new opportunity may present itself for those who missed it the first time.
- Even if the price reaches target (the height of the arrow), the stock can often go much further. Price formations indicate a beginning or continuation of trends. Trends are the strongest indicators we have. While the trend remains intact, the stocks should normally be kept.
Investeringsaanbevelingen worden gedaan door Investtech.com AS ("Investtech"). Investtech garandeert geen volledigheid of juistheid van de analyses. Eventuele fouten in de aanbevelingen, koop- en verkoopsignalen en mogelijke negatieve gevolgen hiervan zijn geheel het risico van de belegger. Investtech neemt geen enkele verantwoordelijkheid voor verlies, direct of indirect, als gevolg van het gebruik van Investtechs analyses. Meer informatie omtrent Investtechs analyses kunt u vinden op disclaimer.
Investeringsaanbevelingen worden gedaan door Investtech.com AS ("Investtech"). Investtech garandeert geen volledigheid of juistheid van de analyses. Eventuele fouten in de aanbevelingen, koop- en verkoopsignalen en mogelijke negatieve gevolgen hiervan zijn geheel het risico van de belegger. Investtech neemt geen enkele verantwoordelijkheid voor verlies, direct of indirect, als gevolg van het gebruik van Investtechs analyses. Meer informatie omtrent Investtechs analyses kunt u vinden op disclaimer.


 Oslo Børs
 Stockholmsbörsen
 Københavns Fondsbørs
 Helsingin pörssi
 World Indices
 US Stocks
 Toronto Stock Exchange
 London Stock Exchange
 Euronext Amsterdam
 Euronext Brussel
 DAX
DAX CAC 40
 Mumbai S.E.
 Commodities
 Currency
 Cryptocurrency
 Exchange Traded Funds
 Investtech Indices