Support and resistance
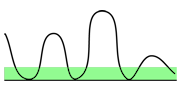
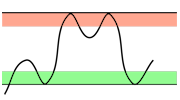
Support and resistance are two of the most central concepts in technical analysis. Studying support and resistance may answer the following questions:
- Where is the price reversal most likely to happen?
- Where are sell and buy signals triggered?
Support and resistance are thus used to find good buy and sell levels.
Main principles
Support levels indicate where there will be a surplus of buyers. This may be because many have seen that the stock has turned upwards from these levels earlier, or that the stock at this level has a low fundamental price.
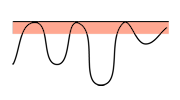
Resistance levels indicate where there will be a surplus of sellers. This may be because the stock has turned downwards from this level before, or that many think it is fundamentally expensive.
This is how support and resistance are normally used:
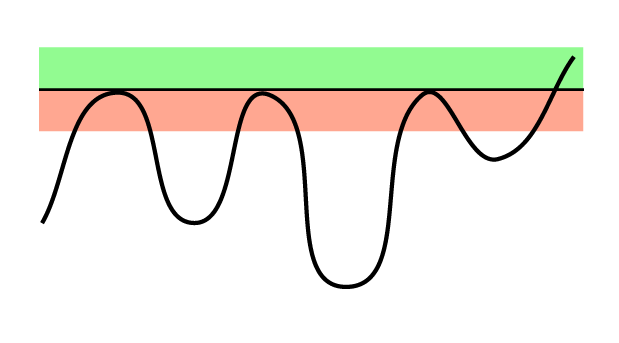
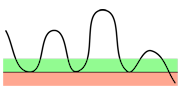
- Buy when the stock falls towards support.
- Sell when the stock rises towards resistance.
- Buy when the stock breaks up through resistance.
- Sell when the stock breaks down through support.
Please note that the price is often very volatile in the areas near support and resistance levels, i.e. it sees great short term fluctuations here. Consequently care should be taken not to place orders directly at support and resistance levels. The price will often not reach all the way to these levels. If you want to buy a stock, it may be a good idea to place a buy order a little above a support level. Similarly it may be a good idea to place a sell order somewhat below a resistance level.
When the price breaks through a resistance level, a buy signal is triggered. When it breaks through a support level, it triggers a sell signal. The price may then change several percentage points in a short time. Trade quickly or wait for a reaction back to get a better price.
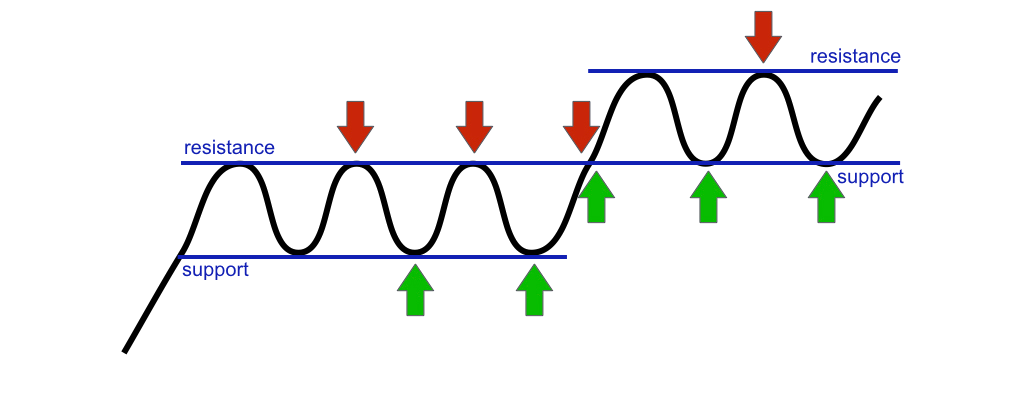
The figure shows how to trade based on support and resistance. Buy near support and sell near resistance. Buy at breaks upward through resistance.
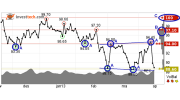
Support is indicated with green horizontal lines and resistance with red lines in Investtech’s charts. The strength of the support and resistance levels are indicated with one to three stars, where three is the strongest. Support will always be below the current price, while resistance will always be above it.
Special circumstances
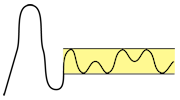
Support and resistance are especially important when the market moves sideways. Very good results can then be achieved through buying near support and selling near resistance.
However, if a stock is in a trend movement, i.e. a rising or falling trend, the trend overrides support and resistance.
Stocks in rising trends
Rising trends in general are strong and reliable positive trend movements. Rising trends continue for longer than many investors think, and often break upward through resistance. This triggers a sell signal, and the price may rise particularly strongly.
In principle this is why a stock in a rising trend should not be sold, even if it approaches resistance, especially in the case of long term investors.
On the contrary, it can be advantageous to buy stocks in rising trends when the stock also approaches horizontal support.
Stocks in falling trends
The opposite is true for falling trends.
In general, do not buy stocks in falling trends, even if they approach support. There is high risk for a break downward which will trigger a sell signal.
On the contrary, it can be advantageous to sell stocks in falling trends when the price has reacted upwards towards horizontal resistance.
Investeringsaanbevelingen worden gedaan door Investtech.com AS ("Investtech"). Investtech garandeert geen volledigheid of juistheid van de analyses. Eventuele fouten in de aanbevelingen, koop- en verkoopsignalen en mogelijke negatieve gevolgen hiervan zijn geheel het risico van de belegger. Investtech neemt geen enkele verantwoordelijkheid voor verlies, direct of indirect, als gevolg van het gebruik van Investtechs analyses. Meer informatie omtrent Investtechs analyses kunt u vinden op disclaimer.
Investeringsaanbevelingen worden gedaan door Investtech.com AS ("Investtech"). Investtech garandeert geen volledigheid of juistheid van de analyses. Eventuele fouten in de aanbevelingen, koop- en verkoopsignalen en mogelijke negatieve gevolgen hiervan zijn geheel het risico van de belegger. Investtech neemt geen enkele verantwoordelijkheid voor verlies, direct of indirect, als gevolg van het gebruik van Investtechs analyses. Meer informatie omtrent Investtechs analyses kunt u vinden op disclaimer.


 Oslo Børs
 Stockholmsbörsen
 Københavns Fondsbørs
 Helsingin pörssi
 World Indices
 US Stocks
 Toronto Stock Exchange
 London Stock Exchange
 Euronext Amsterdam
 Euronext Brussel
 DAX
DAX CAC 40
 Mumbai S.E.
 Commodities
 Currency
 Cryptocurrency
 Exchange Traded Funds
 Investtech Indices