Volume analysis
Volume analysis is greatly underestimated among technical analysts. Volume analysis often gives strong warnings when a stock otherwise looks technically positive. Volume analysis is used to confirm the strength of a buy or sell signal.
Investtech has two important volume indicators; volume balance and price/volume correlation. In addition, we have short term candlestick charts, which make a good starting point for detailed short term volume analyses.
How to use volume analysis?
Trend analysis is central to the Investtech concept. This includes direct visual trend analysis, support and resistance and formation analysis.
Normally a trend analysis is carried out first, and then volume is used to confirm or disprove what the trend analysis shows. If both are positive, the stock can be bought. When already owning a stock, volume analysis is used as a stock health check, to confirm a positive development or be warned of a potential negative reversal.
Guidelines
- If considering buying a stock: it is a signal of strength if the stock has positive volume.
- If considering buying a stock, but it has negative volume: it is recommended to wait or look for other potential stocks.
- Owning a stock that is positive on volume and trend: it is recommended to keep it.
- Owning a stock that is positive on trend but negative on volume: it is recommended to keep a close eye on it. Be ready to sell if the trend signals turn negative as well.
Please note that volume indicators are fairly short term indicators. They are easily influenced by noise. Therefore, be careful not to emphasize volume too much if investing long term and e.g. trading in stocks that are in long term trends. At the same time, volume indicators can quickly catch mood changes among the investors, making it possible to get in or out of stocks early, before the masses start to move. Volume analysis is therefore a very important element for short term, active investors.
Investtech’s volume indicators
Volume balance
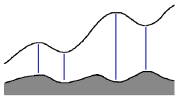
Positive volume balance strengthens buy signals from other indicators, while negative volume balance strengthens sell signals. Likewise, positive volume balance will strengthen or confirm a rising trend, whereas negative volume balance will confirm a falling trend.
Price/volume correlation
Correlation between price development and volume development shows whether volume confirms the overall trend or if it warns of a coming reversal.
Candlesticks
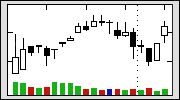
Candlestick analysis is the best tool for doing a detailed short term volume analysis. Candlesticks help identify signals before they appear in the price chart, as well as assist with short term timing and setting limits. Candlesticks also strengthen or weaken more long term trend signals.
Investeringsaanbevelingen worden gedaan door Investtech.com AS ("Investtech"). Investtech garandeert geen volledigheid of juistheid van de analyses. Eventuele fouten in de aanbevelingen, koop- en verkoopsignalen en mogelijke negatieve gevolgen hiervan zijn geheel het risico van de belegger. Investtech neemt geen enkele verantwoordelijkheid voor verlies, direct of indirect, als gevolg van het gebruik van Investtechs analyses. Meer informatie omtrent Investtechs analyses kunt u vinden op disclaimer.
Investeringsaanbevelingen worden gedaan door Investtech.com AS ("Investtech"). Investtech garandeert geen volledigheid of juistheid van de analyses. Eventuele fouten in de aanbevelingen, koop- en verkoopsignalen en mogelijke negatieve gevolgen hiervan zijn geheel het risico van de belegger. Investtech neemt geen enkele verantwoordelijkheid voor verlies, direct of indirect, als gevolg van het gebruik van Investtechs analyses. Meer informatie omtrent Investtechs analyses kunt u vinden op disclaimer.


 Oslo Børs
 Stockholmsbörsen
 Københavns Fondsbørs
 Helsingin pörssi
 World Indices
 US Stocks
 Toronto Stock Exchange
 London Stock Exchange
 Euronext Amsterdam
 Euronext Brussel
 DAX
DAX CAC 40
 Mumbai S.E.
 Commodities
 Currency
 Cryptocurrency
 Exchange Traded Funds
 Investtech Indices


