Key Financial Ratios
Key financial indicators give information about a company's performance based on reported financial results for a given time period.
Many analysts and investors uses key figures from companies' financial results as an important input to calculate actual or theoretical worth. There are different ways of calculating a company's net worth. They are usually based on the latest financial result or year-end-report, but sometimes may be based on a company's expected results.
Based on key financial ratios, if the actual stock price is trading under the theoretical value of the stock, the stock is said to be trading at a discount and is expected to rise in the near future.

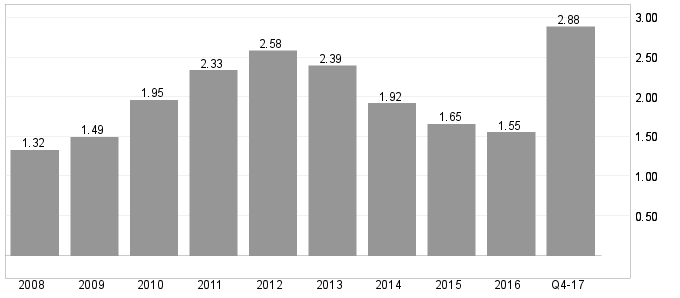
The charts show historical key ratios and figures for up to ten years back in time. The last figure is calculated on the basis of last year's key financial figures and the stock's closing price. For example, if only the first quarterly report is presented, the ratio is based on the sum of last three quarters of the previous year and the first quarter of the year. This will compensate for seasonal fluctuations and compare the figures with previous full-year figures. For previous years' key figures, full year's earnings report and the year's average stock price are used in the calculation. By doing this, historical figures will be constant, while the fresh ones will vary with the change in the stock price.
Most widely used key financial ratios are explained below.
Dividend yield
Dividend yield is company's share dividend in relation to the share price and is a measure of return to shareholders. It is calculated by dividing the amount of dividend paid in a given year by the market price per share and is represented as a percentage.
Dividend yield is a way to measure the cash flow investors get for each dollar invested in the stock. Apart from the share price development, the figure shows what interest rate the share has generated annually.
Example: We compare two stocks in the same sector. Company A pays a dividend of 50 øre per share, while stock B pays a dividend of 1 krone per share. If the stocks of both companies are trading at 20 krone, dividend yield for company A is 2,5 %, while that for company B is 5,0 %.
Given everything else constant, investors who buy shares to increase their annual income would prefer to buy shares of company B over company A as it offers a dividend yield twice that of its peer.
P/E - price/earnings
P/E stands for Price/Earnings, that is, price in relation to the earnings. The P/E ratio is used when assessing a share's price in relation to the company's profit. Example: A P/E number of 10 means that the share costs 10 times the company's annual profit. P/E is calculated as Share price/Earnings after tax per share.
The P/E ratio can tell if investors consider the stock as a value stock or a growth stock , especially when considering the company's growth rate and underlying earnings potential. Value stocks comparatively have stable earnings and relatively low P/E numbers. Growth stocks, on the other hand, have a stronger increase in turnover and earnings, and are expected further increase in P/E figures.
A low P/E, compared to other shares in the same sector, indicates that the stock is relatively cheaper. However, under special circumstances this may not always be the case.
Example: We compare two shares in the same sector. Company A has reported a profit of 1 krone per share, while company B has reported a profit of 2 krone per share. Both are traded for 20 krone in the market. This gives company A a P/E of 20, while company B has a P/E of 10.
This means that company B is much cheaper, relatively speaking. For each share purchased, the investor receives 2 krone in profit, compared with only 1 krone for company A. Given everything else constant, the investor should therefore buy shares in company B.
Note that P/E and other key figures may vary due to different accounting rules and principles in the companies.
P/S - price/sales
P/S stands for Price/Sales, that is, price relative to sales. The key indicator is used when evaluating a share price in relation to the company's sales. Example: A P/S ratio of 2.0 means that the stock costs 2.0 times the company's annual turnover. P/S is calculated as Share price/Revenue per share.
Example: Company A has 10 million outstanding shares and the share price is 90 krone, corresponding to a total value of 900 million krone. Total sales amount to NOK 800 million and the P/S ratio is 1.13.
A low P/S may indicate that the stock is undervalued in the market. Conversely, a high P/S may indicate that the stock is overvalued. Taking above example, if the average P/S ratio of the sector is 1.3, it means that company A is undervalued compared to other companies in the sector.
As with other key figures, be careful about using P/S ratio in isolation. However, the key figures may be useful especially when comparing the valuation of companies in their early-phase that have revenues, but do not profit immediately after inception.
P/B - price/book
P/B stands for Price/BookValue, that is, price relative to equity. The key ratio is used when evaluating a share price in relation to equity. P/B is calculated as Share price/Equity per share. Example: A P/B ratio of 1.8 means that the share costs 1.8 times the company's equity.
A low P/B number may indicate that the stock is undervalued. However, it may also mean that something is fundamentally wrong with the company. This ratio varies considerably across sectors, as there is a big difference in how capital-intensive sectors are.
The P/B ratio gives an indication of what would be achieved if the company were to realize its ownership interests, discontinue operations and pay the capital to shareholders.
Calculation of key ratios
Note that P/E and other key ratios and figures may vary due to different accounting rules and principles in the companies.
Note that there are several ways to calculate key financial indicators/figures. For example, you can include minority interests or not, you can include one-time items or not, and you can use different exchange rates. It could also make a big difference if you look at historical key figures or estimated future figures. Thus, there are often differences in the same key figures from different data suppliers and analysts.
However, the most important thing is that the calculation is done in the same way over time, so that you can track developments in key figures year over year and compare companies against each other, mainly of the same sector.
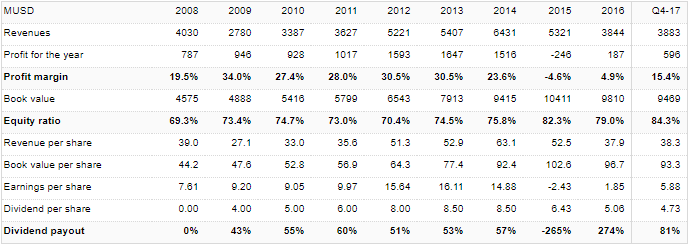
Table: Financial data

The table shows reported accounting figures for up to ten years back in time. The last numbers are consolidated figures for the last 12 months. For example, if only the first quarterly report is presented, the sum is used in the last three quarters of the previous year and the first quarter of the year. Thus, seasonal fluctuations are compensated for and figures can be compared to previous full-year figures.
Die Anlageempfehlungen werden von Investtech.com AS ("Investtech") ausgearbeitet. Investtech übernimmt keine Haftung für die Vollständigkeit oder Richtigkeit der jeweiligen Analyse. Ein etwaiges Engagement aufgrund der aus den Analysen resultierenden Empfehlungen/Signale erfolgt zur Gänze für Rechnung und Risiko des Anlegers. Investtech haftet nicht für Verluste, die sich direkt oder indirekt infolge der Nutzung von Investtechs Analysen ergeben. Angaben zu etwaigen Interessenkonflikten gehen stets aus der Anlageempfehlung hervor. Weitere Informationen zu Investtechs Analysen finden Sie unter disclaimer.
Die Anlageempfehlungen werden von Investtech.com AS ("Investtech") ausgearbeitet. Investtech übernimmt keine Haftung für die Vollständigkeit oder Richtigkeit der jeweiligen Analyse. Ein etwaiges Engagement aufgrund der aus den Analysen resultierenden Empfehlungen/Signale erfolgt zur Gänze für Rechnung und Risiko des Anlegers. Investtech haftet nicht für Verluste, die sich direkt oder indirekt infolge der Nutzung von Investtechs Analysen ergeben. Angaben zu etwaigen Interessenkonflikten gehen stets aus der Anlageempfehlung hervor. Weitere Informationen zu Investtechs Analysen finden Sie unter disclaimer.


 Oslo Børs
 Stockholmsbörsen
 Københavns Fondsbørs
 Helsingin pörssi
 World Indices
 US Stocks
 Toronto Stock Exchange
 London Stock Exchange
 Euronext Amsterdam
 Euronext Brussel
 DAX
DAX CAC 40
 Mumbai S.E.
 Commodities
 Currency
 Cryptocurrency
 Exchange Traded Funds
 Investtech Indices
