Trend signals
Rising trends indicate that the company experiences positive development and increasing buy interest among investors.
The tool Trend signals shows stocks that have recently entered a rising or falling trend. The list can be used to identify buy candidates. A very simple strategy is buying stocks that recently triggered a trend signal and keeping them until they exit the rising trend.
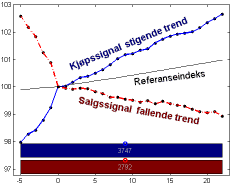
Investtech has conducted reasearch on price development following trend signals. We have developed statistics for the Norwegian and Swedish stock exchanges and assume that the results will hold true for other exchanges as well. The statistics show that stocks in rising trends do better than the exchange average both short and long term, whereas stocks in falling trends do worse.
Thus analysis of trends and trading based on trend signals are important parts of technical analysis.
Table explanation

Days in trend: Number of days the stock has been in the trend drawn in the chart.
Rising rate (degrees): Visual rising rate of the trend channel in the chart. From 0 (horizontal) to 90 degrees (vertical).
Rising rate (pct.): Rising rate in percentage if the stock continues in the trend channel for one year.
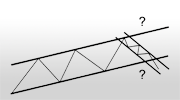
Note that a stock can enter a rising trend in two ways: 1) The trend in the chart changes, for example from an (old) falling trend to a (new) rising trend. 2) The price was above the trend ceiling or below the trend floor and entered the trend.
Good statistical basis
 A research report from Investtech dated May 2016 shows that a stock tends to follow the trend it is in. Thus if the stock is in a rising trend, it will continue to rise. If it is in a falling trend, it will continue to fall. This can be partly explained by the fact that news tend to come in series. A positive piece of news is usually followed by more positive news. The market grasps the first positive news, but not the probability of more positive news to follow. Consequently it can pay off to buy stocks that show positive development, anticipating that the trend will continue.
Investtech has developed computer systems that automatically identify rising and falling trends. In the period 1996 to 2015, 28,580 buy signals from stocks entering rising trends were identified, along with 16,348 sell signals from stocks entering falling trends. Investtech’s research report shows that the stocks in rising trends on average went up 5.5 per cent the following months, while stocks in falling trends on average rose by 0.9 per cent. In comparison the benchmark indices on average rose by 3.6 per cent in 3 months.
Die Anlageempfehlungen werden von Investtech.com AS ("Investtech") ausgearbeitet. Investtech übernimmt keine Haftung für die Vollständigkeit oder Richtigkeit der jeweiligen Analyse. Ein etwaiges Engagement aufgrund der aus den Analysen resultierenden Empfehlungen/Signale erfolgt zur Gänze für Rechnung und Risiko des Anlegers. Investtech haftet nicht für Verluste, die sich direkt oder indirekt infolge der Nutzung von Investtechs Analysen ergeben. Angaben zu etwaigen Interessenkonflikten gehen stets aus der Anlageempfehlung hervor. Weitere Informationen zu Investtechs Analysen finden Sie unter disclaimer.
Die Anlageempfehlungen werden von Investtech.com AS ("Investtech") ausgearbeitet. Investtech übernimmt keine Haftung für die Vollständigkeit oder Richtigkeit der jeweiligen Analyse. Ein etwaiges Engagement aufgrund der aus den Analysen resultierenden Empfehlungen/Signale erfolgt zur Gänze für Rechnung und Risiko des Anlegers. Investtech haftet nicht für Verluste, die sich direkt oder indirekt infolge der Nutzung von Investtechs Analysen ergeben. Angaben zu etwaigen Interessenkonflikten gehen stets aus der Anlageempfehlung hervor. Weitere Informationen zu Investtechs Analysen finden Sie unter disclaimer.


 Oslo Børs
 Stockholmsbörsen
 Københavns Fondsbørs
 Helsingin pörssi
 World Indices
 US Stocks
 Toronto Stock Exchange
 London Stock Exchange
 Euronext Amsterdam
 Euronext Brussel
 DAX
DAX CAC 40
 Mumbai S.E.
 Commodities
 Currency
 Cryptocurrency
 Exchange Traded Funds
 Investtech Indices

