Signals from head and shoulders formations, Oslo Stock Exchange 1996-2014
Research results from Investtech, 18 December 2014
Published in English on 30 December 2014. Norwegian original here >>
Stocks with sell signals from long term head and shoulders formations fell on average by 4.4 % in the three months following the signal. Stocks with long term buy signals from inverse head and shoulders formations rose on average by 13.9 % in the next three months. This is shown in a research report from Investtech based on 19 years of data from the Oslo Stock Exchange.
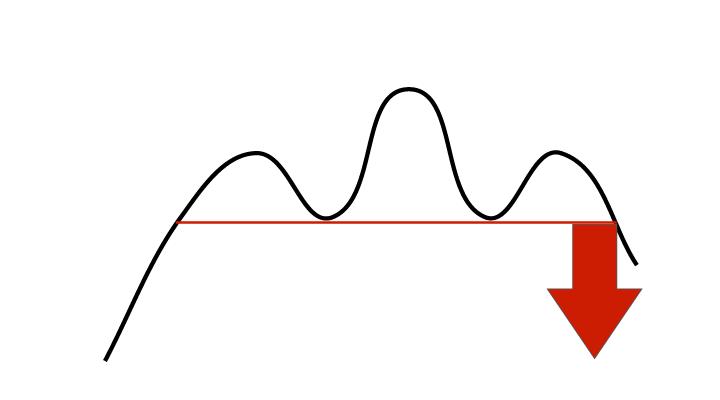
A head and shoulders formation is a top formation which marks the end of a rising period. The formation consists of a left shoulder, a head and a right shoulder, connected by a neckline, see figure 1. The creation of a head and shoulders formation mirrors increasing pessimism among investors and the beginning of a falling trend. Such formations are often considered some of the most reliable formations in technical analysis. They are used to predict price reversals in long term market trends, but are also used in the shorter term.
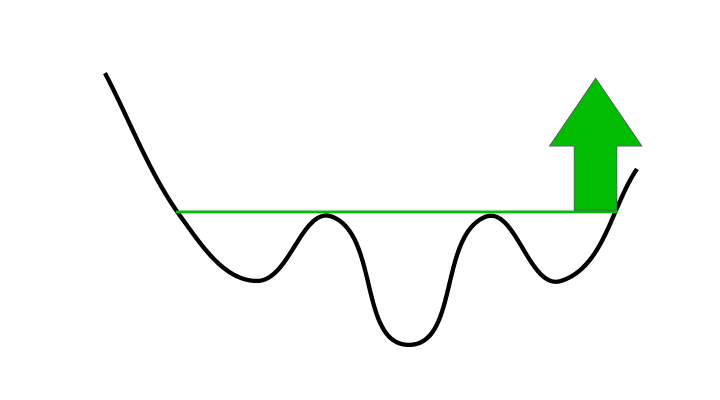
There is also an opposite version of this formation, the inverse head and shoulders formation, see figure 2. This is a is a bottom formation which marks the end of a falling trend. An inverse head and shoulders formation indicates increasing optimism among investors and the beginning of a rising trend..

Figure 1: Sell signal from a head and shoulders formation.

Figure 2: Buy signal from an inverse head and shoulders formation.
In technical analysis terminology a break down through the neckline of a head and shoulders formation triggers a sell signal. Similarly a break upwards from an inverse head and shoulders formation triggers a buy signal.
Investtech’s Head of Research Mr. Linløkken has studied the price movements that have followed such buy and sell signals on Norway’s Oslo Stock Exchange in a period of 19 years, from 1996 to 2014.
Investtech’s computers identified 111 buy signals and 144 sell signals in this period.
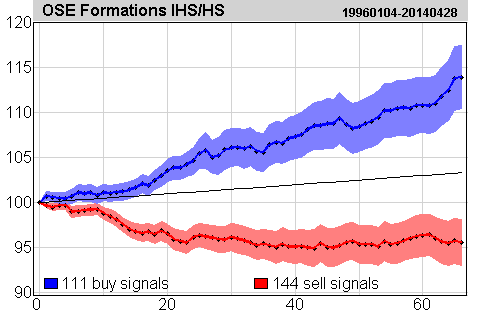
Figure 3: Price development after buy and sell signals from inverse/head and shoulders formations on the Oslo Stock Exchange identified by Investtech’s automatic algorithms in long term price charts. Click the image for bigger version.
The chart shows average price development 66 days after buy signals from inverse head and shoulders formations and sell signals from head and shoulders formations. The signals are triggered on day 0. Only days when the exchange is open are included, so 66 days equal approximately 3 months. Buy signals are the blue line and the sell signals are the red one. The shaded areas show the standard deviation for these calculations. The black line is the benchmark index.
On average, stocks with buy signals rose by 13.9 % in 3 months, whereas stocks with sell signals fell by 4.4 %.
These statistics are based on a relatively small number of data points, and the results from the Swedish Stockholm Stock Exchange are not this good. Further studies are thus required, including studies of other price formations that signal long term trend reversals.
Read the complete research report here for more results and details.
Keywords: Buy signal,Head and shoulders formation,Inverse head and shoulders formation,Oslo Stock Exchange,Sell signal,statistics.
Written by

Head of Research and Analysis
at Investtech
Insight & Skills:
Buy signal from inverse head and shoulders formation
Sell signal from head and shoulders formation
Research results:
Return following signals from rectangle formations – the Oslo Stock Exchange 1996-2014
Return following signals from rectangle formations – the Stockholm Stock Exchange 2003-2014
Return following signals from head and shoulders formations - the Oslo Stock Exchange 1996-2014
Investtech guarantees neither the entirety nor accuracy of the analyses. Any consequent exposure related to the advice / signals which emerge in the analyses is completely and entirely at the investors own expense and risk. Investtech is not responsible for any loss, either directly or indirectly, which arises as a result of the use of Investtechs analyses. Details of any arising conflicts of interest will always appear in the investment recommendations. Further information about Investtechs analyses can be found here disclaimer.
The content provided by Investtech.com is NOT SEC or FSA regulated and is therefore not intended for US or UK consumers.


 Oslo Børs
 Stockholmsbörsen
 Københavns Fondsbørs
 Helsingin pörssi
 World Indices
 US Stocks
 Toronto Stock Exchange
 London Stock Exchange
 Euronext Amsterdam
 Euronext Brussel
 DAX
DAX CAC 40
 Mumbai S.E.
 Commodities
 Currency
 Cryptocurrency
 Exchange Traded Funds
 Investtech Indices


