Statistics on short term rectangle formations – Oslo Stock Exchange 1996 - 2014
Published 14 June 2017
A research report from Investtech based on 19 years of data from the Oslo Stock Exchange in Norway shows that buy signals from short term rectangle formations statistically gave a price increase of 4.7 per cent in the three months following the signal. Stocks with sell signals from short term rectangle formations on average increased by 1.9 % the following three months.
Identification of geometric price patterns in stock prices is an important area of technical analysis. The idea is that these patterns describe the investors’ mental state, i.e. whether they will want to sell or buy stocks in the time ahead, and they thereby indicate the future direction of the stock price. Rectangle formations are one type of such patterns.
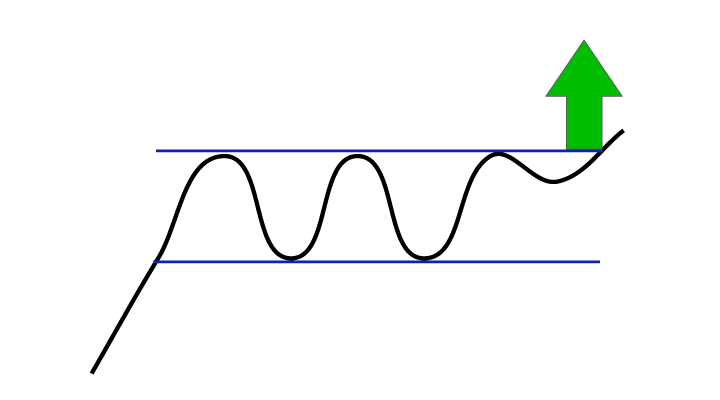
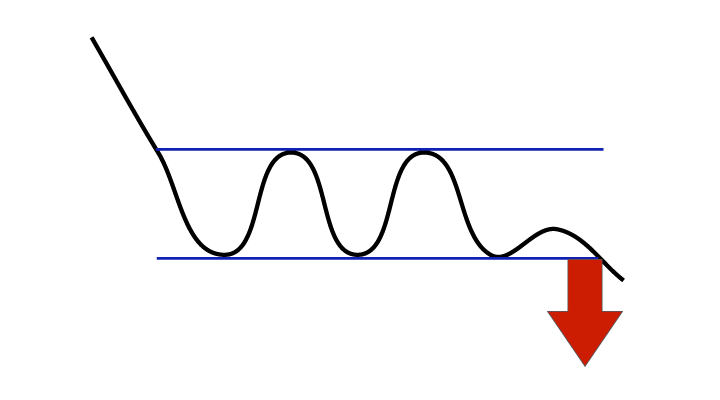
The development of a rectangle formation mirrors uncertainty among investors about the stock’s direction. The price moves sideways between support and resistance. A break upwards signals increasing investor optimism, while a break downwards signals increasing pessimism.

Figure 1: Buy signal from rectangle formation.

Figure 2: Sell signal from rectangle formation.
In technical analysis terminology we say that a break upwards triggers a buy signal. Similarly a break downwards from a rectangle formation triggers a sell signal. We have investigated the price movements following buy and sell signals from short term rectangle formations on Norway’s Oslo Stock Exchange.
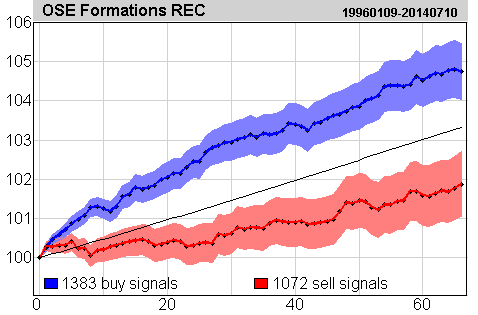
Investtech’s computers identified a total of 1,383 buy signals and 1,072 sell signals in this period.

Figure 3: Price development following buy and sell signals from rectangle formations on the Oslo Stock Exchange identified by Investtech’s automatic algorithms in short term charts. Click the image for bigger version.
The chart shows average price development following buy and sell signals from rectangle formations. The signals are triggered on day 0. Only days when the exchange is open are included, so 66 days equal approximately 3 months. Buy signals are the blue line and the sell signals are the red one. The shaded areas show the standard deviation for these calculations. The black line is the benchmark index.
Buy signals have an average return of 4.7 % in the three months following the signal, and sell signals a return of 1.9 %. Relative to average benchmark development, buy signals gave an excess return of 1.4 percentage points and sell signals a negative excess return of 1.4 percentage points.
You will find more results and details in the research report here.
Keywords: Buy signal,Oslo Stock Exchange,rectangle,Sell signal,short term,statistics.
Written by

Head of Research and Analysis
at Investtech
Investtech guarantees neither the entirety nor accuracy of the analyses. Any consequent exposure related to the advice / signals which emerge in the analyses is completely and entirely at the investors own expense and risk. Investtech is not responsible for any loss, either directly or indirectly, which arises as a result of the use of Investtechs analyses. Details of any arising conflicts of interest will always appear in the investment recommendations. Further information about Investtechs analyses can be found here disclaimer.
The content provided by Investtech.com is NOT SEC or FSA regulated and is therefore not intended for US or UK consumers.


 Oslo Børs
 Stockholmsbörsen
 Københavns Fondsbørs
 Helsingin pörssi
 World Indices
 US Stocks
 Toronto Stock Exchange
 London Stock Exchange
 Euronext Amsterdam
 Euronext Brussel
 DAX
DAX CAC 40
 Mumbai S.E.
 Commodities
 Currency
 Cryptocurrency
 Exchange Traded Funds
 Investtech Indices


