Global stocks: 1 Buy and 2 Sell Signals
Published December 05, 2018
Webinar December 13
Join our free online webinar on December 13, 15.00-15.45 CET. Analyst Kiran Shroff and Country Manager Jan Marius van Leeuwen will give an introduction to Investtech's analyses and present stock picking tools & strategies.
US markets were down on Tuesday with all three major indices DJIA , S&P 500 and NASDAQ losing over 3 per cent each. The main reason was fear due to narrowing and eventually a crossover between the short term and the long term treasury notes, which is called yield spread. The yield spread indicates the likelihood of a recession or recovery one year forward.
Experts suggests that such negative crossovers earlier, where the short term rates rise over longer term rates, have been followed by a period of recession. Only time can tell if this fear is short lived and the yield spread starts to widen again or if it is going to overshadow the markets in the future.
Today we have analysed three US stocks that are world renowned companies and belong to different sectors: one sports brand, another in consumer packaged goods and one in aviation.
Nike Inc (NKE.US) Close: 75.79
Nike Inc is in a rising trend channel in the medium term. This signals increasing optimism among investors and indicates continued rise.
The stock tested its earlier support at 71 dollars and reacted upwards to rise above its resistance of 75.40 dollars. On the upside there is resistance around 78-79.70 dollars in the short term and 85.50 or equivalent to 12.8 per cent higher in the medium term. In case of a downward reaction, there is support between 72 and 70 dollars.
Investtech's outlook (one to six months): Buy
The Kraft Heinz Company(KHC.US) Close: 49.98
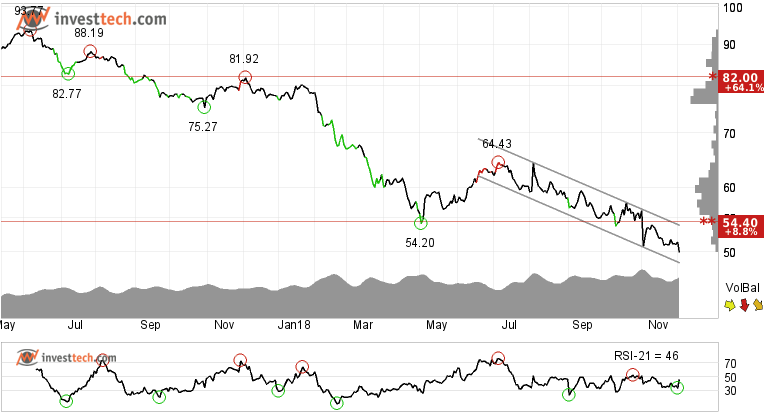
The Kraft Heinz Company shows weak development in a falling trend channel both in the short, medium and long term. Falling trends indicate that the company experiences negative development and falling buy interest among investors.
The stock prices have almost halved since the top in February 2017. There is no sign of respite seen in the stock as it closed yesterday at its all time low. Negative volume balance and weak momentum adds weightage to the falling prices. The stock has resistance around 54.40 dollars. However, in the short term chart there are multiple resistance levels which the stock needs to break and close above before the sell recommendation can be revoked.
Investtech's outlook (one to six months): Sell
American Airlines Grou (AAL.US) Close: 36.69
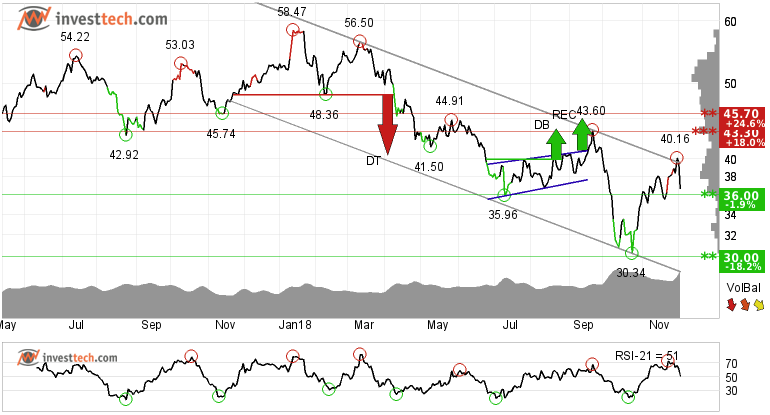
Investors over time have sold at lower prices to get out of American Airlines Group Inc. as the stock is inside a falling trend channel in the medium term.
The ceiling of the falling trend channel was being tested around 40 dollars before the stock price resumed its downward trend. The stock is just above its interim support of 36 dollars, which if broken may lead the price to tumble down to 30 dollars or lower. There is resistance between 43.30 and 45.70 before a change in trend can be seen.
Further, negative volume balance indicates that volume is high on days with falling prices and low on days with rising prices, which weakens the stock. The stock is overall assessed as technically negative for the medium term.
Investtech's outlook (one to six months): Sell
The analyses are based on closing price as per December 05, 2018.
Note: These instruments are traded in currency based on the exchange or country they are listed on.
Written by

Analyst - Investtech
"Investtech analyses the psychology of the market and gives concrete trading suggestions every day."

Partner & Senior Advisor - Investtech
Investtech guarantees neither the entirety nor accuracy of the analyses. Any consequent exposure related to the advice / signals which emerge in the analyses is completely and entirely at the investors own expense and risk. Investtech is not responsible for any loss, either directly or indirectly, which arises as a result of the use of Investtechs analyses. Details of any arising conflicts of interest will always appear in the investment recommendations. Further information about Investtechs analyses can be found here disclaimer.
The content provided by Investtech.com is NOT SEC or FSA regulated and is therefore not intended for US or UK consumers.


 Oslo Børs
 Stockholmsbörsen
 Københavns Fondsbørs
 Helsingin pörssi
 World Indices
 US Stocks
 Toronto Stock Exchange
 London Stock Exchange
 Euronext Amsterdam
 Euronext Brussel
 DAX
DAX CAC 40
 Mumbai S.E.
 Commodities
 Currency
 Cryptocurrency
 Exchange Traded Funds
 Investtech Indices


