Global stocks: Four buys based on our Top 50 list
Published March 14, 2019
Investtech has been publishing technical analysis for over 21 years now and over the years has created a system that works on its own. Algorithms are created in such a way that they go through every stock of 12 countries that we have data for, and gives each a score based on the stock's position with respect to trend channel, volume, price formations, support and resistance and momentum. The score's range is between +100 and -100 and those that are highest scored appears on our Top 50 list on either side, both positive or negative.
We kept our goal easy today and went through the Top 50 list of positive and liquid stocks with the highest scores to find two stocks from two exchanges each, S&P 500 and OMX Copenhagen (all stocks in the second case). In the analysis we explain positioning of the stock price with respect to trend channel and all other parameters that have been mentioned above. This makes it easy for you to understand the logic behind our analysis.
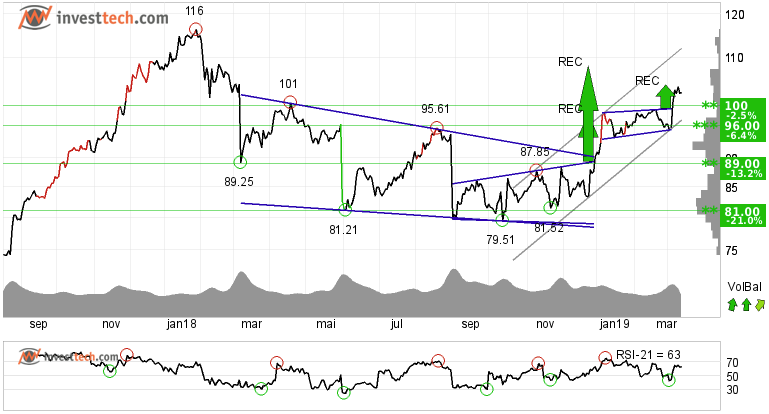
Dollar Tree (DLTR.US) Close: 102.56
Top on the Top 50 list of S&P 500 stocks with an overall score of 92, Dollar Tree shows strong development within a rising trend channel in the short, medium and long term charts. The stock has given breakouts from rectangle formations at multiple occasions. It managed to break above the 100 mark on high volume in the past few days. A support is now established around the 100 and 96 dollar levels.
The momentum is strong and the volume balance indicator, as shown by green up arrows in the bottom right corner of the chart, is positive. Together they signal increasing optimism among investors and indicate continued rise.
There is resistance around 116 dollars in the longer term chart. Hence one must be conscious, but if the stock price manages to close and stay above that level, it will explore new territory and may go higher. The stock is overall assessed as technically positive for the medium term.
Investtech's outlook (one to six months): Buy
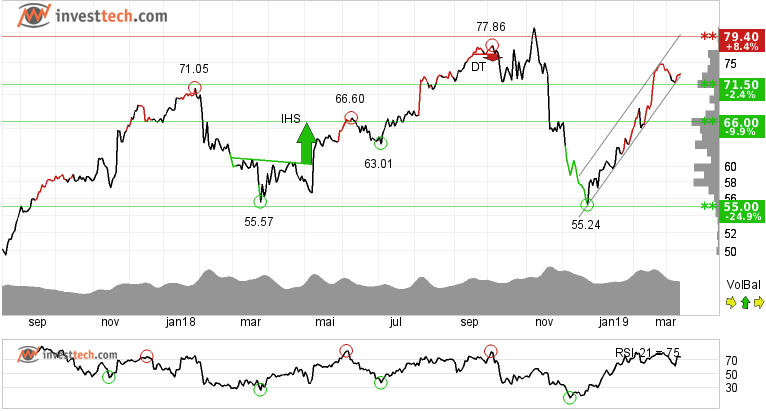
Jacobs Engineering Gro (JEC.US) Close: 73.27
After a steep fall from the high in early November last year, the Jacobs Engineering Group stock price has reacted strongly and has risen by 32 per cent in past three months.
The stock has an score of 88 points and there are many reasons for that. First is the nearness of the price to its support line of the rising trend channel. Second is that it is close to support at 71.50 which gives a high probability that the stock may rise again. Third is the rising momentum and positive volume balance.
There is now resistance around 79.40 and support at 71 which gives a favourable reward and risk ratio.
Investtech's outlook (one to six months): Buy
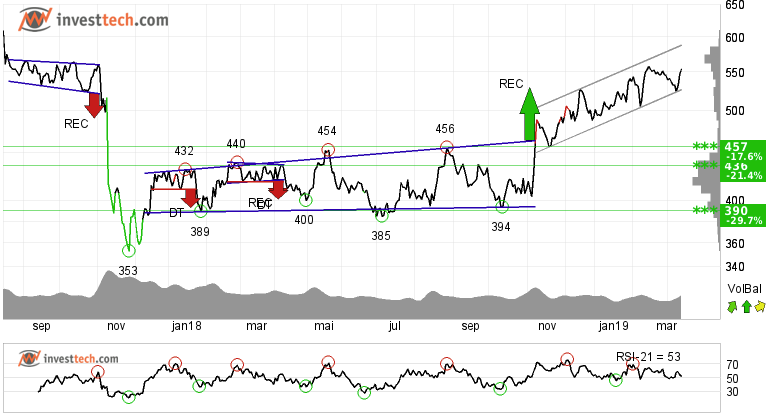
Vestas Wind Systems (VWS.CO) Close: 554.60
Vestas Wind Systems is the top scorer on the The Copenhagen Fonds Exchange with a score of 90 points and is showing strong development within the rising trend channel. The stock gave a positive breakout from a rectangle formation in early November and the target from the formation has been achieved. But the formation suggests continued rise unless broken otherwise.
Next resistance is not before 614 Danish kroner as suggested by the longer term chart, however there is support around 526 in the short term.
Investtech's outlook (one to six months): Buy
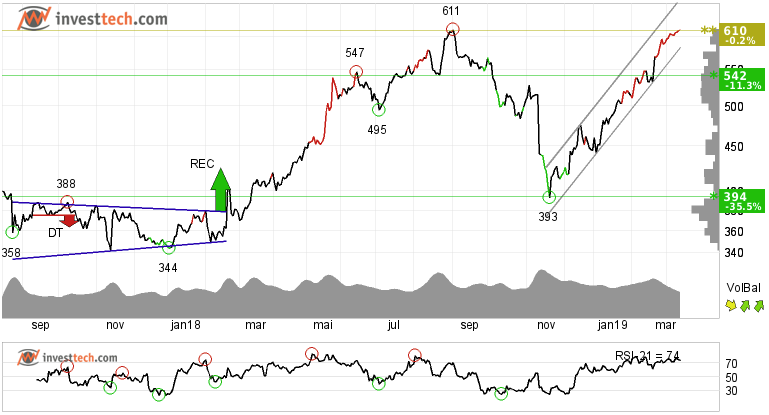
SimCorp (SIM.CO) Close: 611.00
The Copenhagen Fonds Exchange listed stock SimCorp is the third on the Top 50 list of positive stocks. It has reacted strongly after establishing a bottom at 393 Danish kroner. The current position can be little tricky, as the stock is close to its earlier resistance and all time high of 611. However, if it manages to close and stay above that level, we may see fresh buying coming in.
Momentum in the stock is very strong as RSI is above 70. Volume balance indicators both in the medium term and long term are positive, which adds strength to the underlying trend. The stock has support around 542 kroner which is 11 per cent lower that the last close, hence one must be cautious and maintain proper stoploss with respect to lower time frame charts. The stock is overall assessed as technically positive in the medium term.
Investtech's outlook (one to six months): Buy
The analyses are based on closing price as per March 13, 2019
Note: These instruments are traded in currency based on the exchange or country they are listed on.
Written by

Analyst - Investtech
"Investtech analyses the psychology of the market and gives concrete trading suggestions every day."

Partner & Senior Advisor - Investtech
Investtech guarantees neither the entirety nor accuracy of the analyses. Any consequent exposure related to the advice / signals which emerge in the analyses is completely and entirely at the investors own expense and risk. Investtech is not responsible for any loss, either directly or indirectly, which arises as a result of the use of Investtechs analyses. Details of any arising conflicts of interest will always appear in the investment recommendations. Further information about Investtechs analyses can be found here disclaimer.
The content provided by Investtech.com is NOT SEC or FSA regulated and is therefore not intended for US or UK consumers.


 Oslo Børs
 Stockholmsbörsen
 Københavns Fondsbørs
 Helsingin pörssi
 World Indices
 US Stocks
 Toronto Stock Exchange
 London Stock Exchange
 Euronext Amsterdam
 Euronext Brussel
 DAX
DAX CAC 40
 Mumbai S.E.
 Commodities
 Currency
 Cryptocurrency
 Exchange Traded Funds
 Investtech Indices