Global stocks: Big US stocks - two buy and one sell
Published August 7, 2019
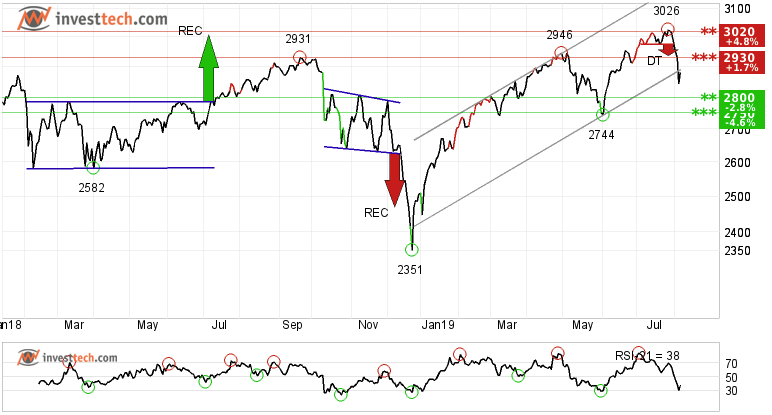
S&P 500 (SP500) developed positively on Tuesday and gained 1.30 per cent to a close of 2,882 points. The index thereby reversed up after six days of losses. S&P 500 has broken the rising trend channel in the short and medium term and has established a small double top formation. But the long term trend channel is still intact and only 1.3 per cent away from its resistance of 2,930 points. Looking at the bigger picture, the index has support between 2,800 and 2,745 points. A break and close below this level may trigger panic among investors.
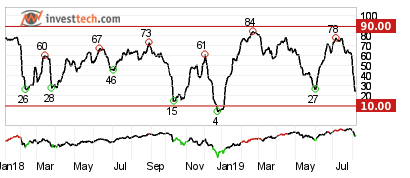
Hausse index: To gauge the sentiment and optimism among investors, Investtech has developed the Hausse Indices. They show the ratio of investors who are positive in the market. The index has a value between 0 and 100, where 0 means that every company’s last signal was a sell signal, and 100 means that every company’s last signal was a buy signal. Values above 50 indicate that a majority of investors are positive.
As per Tuesday's close, the Hausse index suggests that the short term investors are skeptical about the course of the broader market as suggested by Hausse 1 (short term trading range), which fell by 30 points from last week to close at 25 points yesterday. On the other hand, among medium and long term investors, optimism outweighs pessimism as Hausse 2 (long term trading range) closed at 56 points.
Overall the index value matches well with the development of the charts and suggests caution for the short term investors while it still holds bullish sentiment in the long term.
We write about three stocks that are listed on S&P 500. The main criteria for today's selection was liquidity, which was set above 300 million dollars or above. The next step was to see only technically positive stocks. As we set the stock selection criteria, it gave us a list of 80 stocks. However, we are writing about two stocks today that top the list on the basis of overall score irrespective of sector.
Twitter Inc. (TWTR.US) Close: 41.32
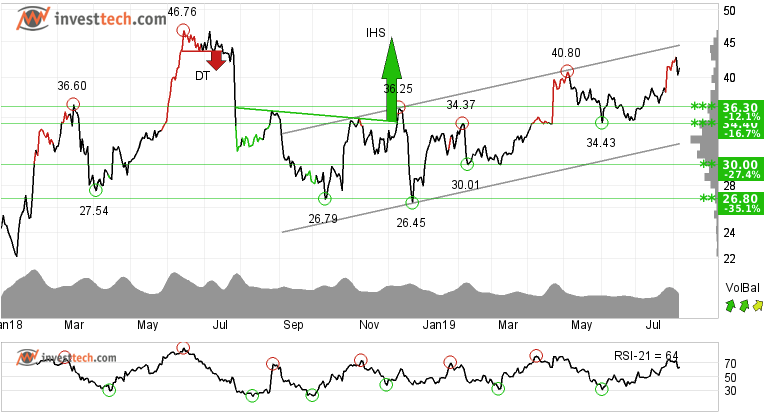
Twitter Inc. shows strong development within a rising trend channel in all time frames; short, medium and long term. This signals increasing optimism among investors who have steadily paid more to buy the stock, which indicates increasing optimism and that the price may continue to rise.
Since the end of last year, the stock has risen by over 56 per cent. There is resistance around 47 dollars in the long term. A break and close above that level may lead to fresh buying in the stock. On the downside there is support around 36.30 dollars and major one at the 34.40 level.
Positive volume balance indicates that buyers are aggressive while sellers are passive, with high volume on days with rising prices and low volume on days with falling prices. This strengthens the stock further. The stock is overall assessed as technically positive for the medium term.
Investtech's outlook (one to six months): Positive
Walt Disney Co (The) (DIS.US) Close: 141.87
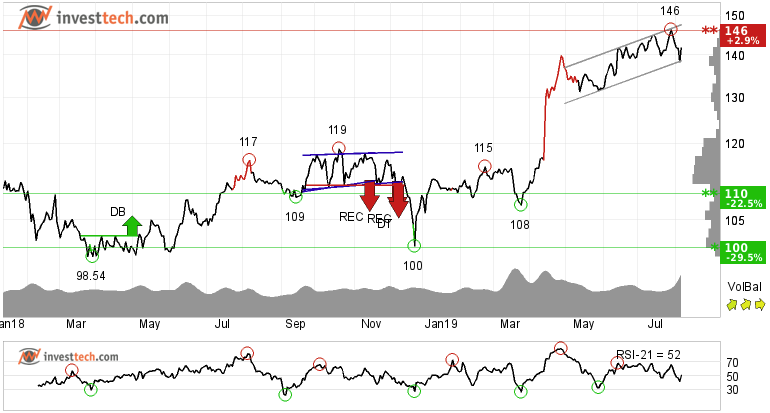
Investors have paid higher prices over time to buy in Walt Disney Co and the stock is inside a rising trend channel in the medium term. This signals increasing optimism among investors and indicates continued rise. In early April the stock gave a breakout and initiated a buy signal from a rectangle formation. The stock has behaved strongly since then and is expected to continue as suggested by the formation.
Currently it is under the short term resistance of 146 dollars, while there is support at 132 in the short term. One must keep in mind that the company came out with its quarterly numbers on Tuesday evening, and hence a reaction is expected in today's trade. The stock is overall assessed as technically positive for the medium term.
Investtech's outlook (one to six months): Positive
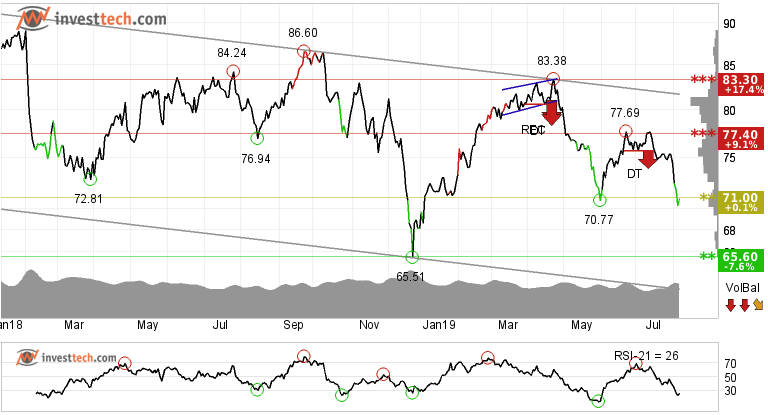
Exxon Mobil (XOM.US) Close: 70.96
Exxon Mobil is in a falling trend channel in the medium and long term. This signals increasing pessimism among investors and indicates further decline for Exxon Mobil. The oil and gas giant is testing the resistance at dollar 71.00, which may give a negative reaction. There is support around 65.60 dollars. However, a break and close below that level may initiate fresh selling.
The volume balance is negative and weakens the stock in the short term. The RSI curve shows a falling trend, which supports the negative trend. RSI below 30 shows that the momentum of the stock is strongly negative in the short term. The stock is overall assessed as technically negative for the medium long term.
Investtech's outlook (one to six months): Negative
The analyses are based on closing price as per August 6, 2019
Note: These instruments are traded in currency based on the Exchange or country they are listed on.
Written by

Analyst - Investtech
"Investtech analyses the psychology of the market and gives concrete trading suggestions every day."

Partner & Senior Advisor - Investtech
Investtech guarantees neither the entirety nor accuracy of the analyses. Any consequent exposure related to the advice / signals which emerge in the analyses is completely and entirely at the investors own expense and risk. Investtech is not responsible for any loss, either directly or indirectly, which arises as a result of the use of Investtechs analyses. Details of any arising conflicts of interest will always appear in the investment recommendations. Further information about Investtechs analyses can be found here disclaimer.
The content provided by Investtech.com is NOT SEC or FSA regulated and is therefore not intended for US or UK consumers.


 Oslo Børs
 Stockholmsbörsen
 Københavns Fondsbørs
 Helsingin pörssi
 World Indices
 US Stocks
 Toronto Stock Exchange
 London Stock Exchange
 Euronext Amsterdam
 Euronext Brussel
 DAX
DAX CAC 40
 Mumbai S.E.
 Commodities
 Currency
 Cryptocurrency
 Exchange Traded Funds
 Investtech Indices