Global stocks: One buy and one sell
Published November 6, 2019
It seems that the global markets are moving in harmony as most of the world indices are making new highs or at least multi-year highs. We have focused a lot on US and German markets, but we have not written anything about the Dutch stock market recently. Now is the time.
To give you a little background on the stocks we are covering today, one is a world renowned Dutch beer brand that is widely sold in a green bottle with a red star. You guessed it right, it is Heineken. And the other one is again a Dutch multinational banking and financial services corporation called ING Bank NV with revenues of approximately 18.08 billion euros. Following are the analyses of the AEX-index and the two Dutch stocks.
AEX-index (AEX.AS) Close: 590.65
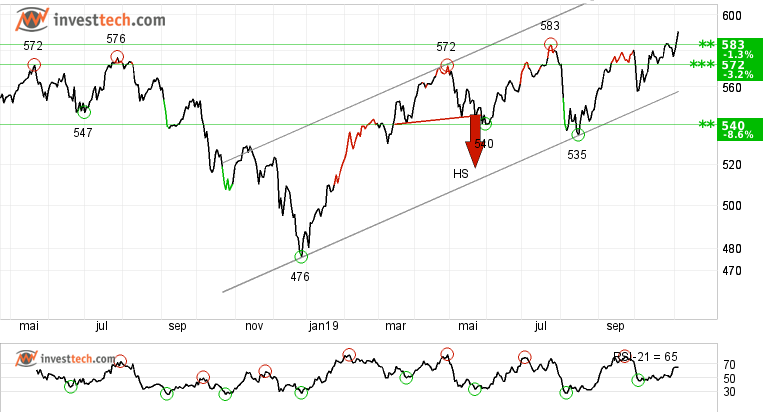
The AEX-index is at its highest since June 2001 and closed at 590.65 points on Tuesday. The index had given a false signal from the head and shoulders formation in May this year, but managed to pull back and established support around the 540-535 area. It is now above its long standing resistance of 583 points, which the index has tested on few occasions before. The index is expected to stay above the support, but in case of any correction there is support further down at 573 and 558 points.
ING Groep NV (INGA.AS) Close: 10.55
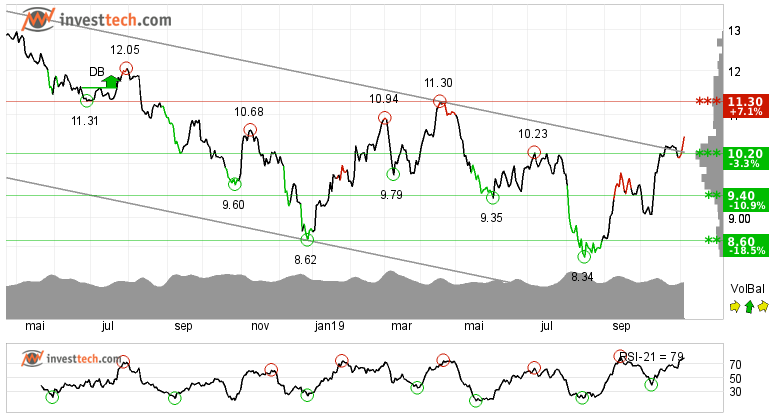
ING Groep NV has broken the ceiling of the falling trend both in the medium and long term. In the beginning this indicates either a slower initial falling rate or the development of a more sideways trend. The stock has recently broken the resistance at 10.20 euros and now has support at the same level. It has a resistance at euro 11.30 which if broken and if the stock manages to close above that level can initiate a new buying spree.
The current movement has strong momentum as the momentum indicator RSI is above 70. It suggests that the investors have steadily paid more to buy the stock, which indicates increasing optimism and that the price will continue to rise. The volume balance indicator is also turning its head towards positive and indicates that more and more players are now buying the stock at rising prices. Further rise in stock price is expected.
Investtech's outlook (one to six months): Weak Positive
Heineken NV (HEIA.AS) Close: 89.82
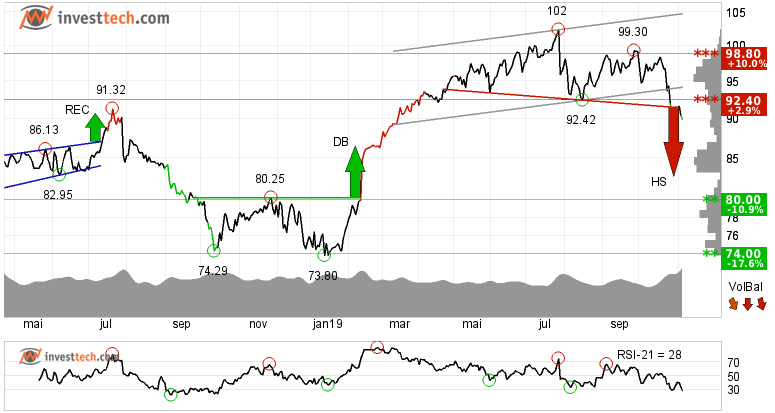
Heineken NV has broken the floor of the rising trend channel in the medium term, which indicates initially a weaker rising rate or development of a sideways trend. The stock gave a negative signal from a head and shoulders formation by the break down through the support at 91.40. Further fall to 82.71 euros or lower is signalled. The stock has support at 80.00 and resistance at 92.40 euros.
Negative volume balance indicates that volume is high on days with falling prices and low on days with rising prices, which weakens the stock. RSI below 30 shows that the momentum of the stock is strongly negative in the short term. Investor have steadily reduced the price to sell the stock, which indicates increasing pessimism and continued falling prices. The stock is overall assessed as technically negative for the medium long term.
Investtech's outlook (one to six months): Negative
The analyses are based on closing price as per November 5, 2019. Figures of revenue taken from the internet.
These instruments are traded in currency based on the Exchange or country they are listed on.
Written by

Analyst - Investtech
"Investtech analyses the psychology of the market and gives concrete trading suggestions every day."

Partner & Senior Advisor - Investtech
Investtech guarantees neither the entirety nor accuracy of the analyses. Any consequent exposure related to the advice / signals which emerge in the analyses is completely and entirely at the investors own expense and risk. Investtech is not responsible for any loss, either directly or indirectly, which arises as a result of the use of Investtechs analyses. Details of any arising conflicts of interest will always appear in the investment recommendations. Further information about Investtechs analyses can be found here disclaimer.
The content provided by Investtech.com is NOT SEC or FSA regulated and is therefore not intended for US or UK consumers.


 Oslo Børs
 Stockholmsbörsen
 Københavns Fondsbørs
 Helsingin pörssi
 World Indices
 US Stocks
 Toronto Stock Exchange
 London Stock Exchange
 Euronext Amsterdam
 Euronext Brussel
 DAX
DAX CAC 40
 Mumbai S.E.
 Commodities
 Currency
 Cryptocurrency
 Exchange Traded Funds
 Investtech Indices


