Global stocks: Good opportunities in Tesla and Baidu stocks
Published November 13, 2019
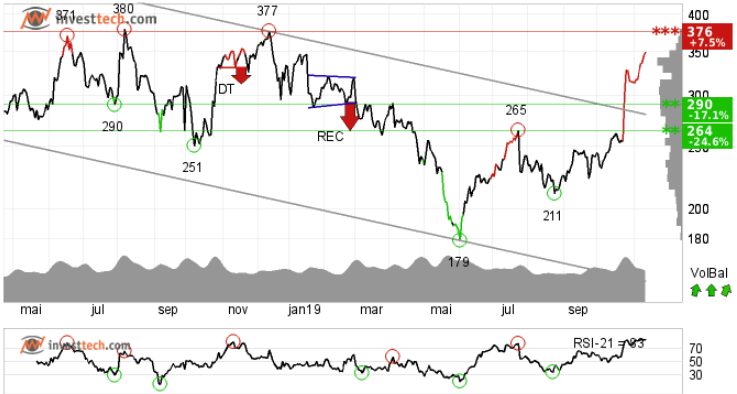
Tesla Inc (TSLA.US) Close: 349.93
Tesla Inc. has broken the ceiling of the falling trend in the medium term. In the beginning this indicates either a slower initial falling rate or the development of a more sideways trend. However, the stock is in a rising trend channel both in the short and long term charts. This makes the overall trend image for the stock brighter.
The stock has recently broken the resistance at 264 and 290 dollars on high volume. The sharp rise in price is also accompanied by higher volatility. Hence one can expect swift movements in the stock price for the days to come.
The next resistance level is around 376-380 dollars which has been tested on many occasions earlier. A break and close above this level may initiate fresh buying in the stock.
Positive volume balance, with high volume on days of rising prices and low volume on days of falling prices, strengthens the stock in the short term. RSI above 70 shows that the stock has strong positive momentum in the short term. Investors have steadily paid more to buy the stock, which indicates increasing optimism and that the price will continue to rise.
Investtech's outlook (one to six months): Positive
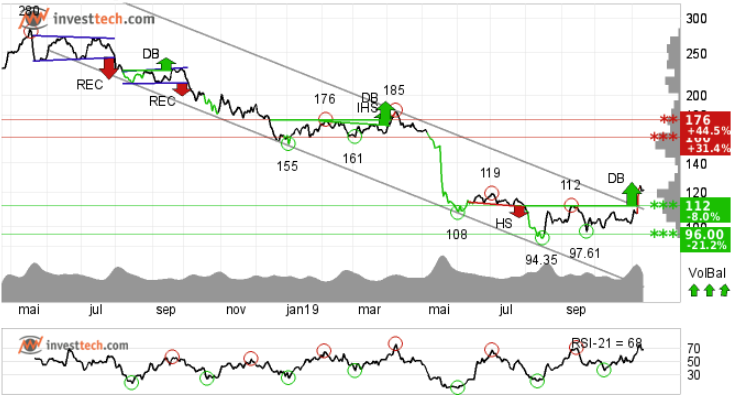
Baidu, Inc. (BIDU.US) Close: 121.80
Baidu Inc. has broken above the ceiling of the falling trend channel stretching over a year, both in the medium and long term charts. The stock has also given a buy signal through a breakout from a double bottom formation. The target from the formation is around 126 dollars, but the formation itself suggest further rise in price. The next resistance is at 160 and 176 dollars respectively, and the support is at 112 and 90 dollars.
The current movement has strong momentum as the momentum indicator RSI is above 70. It suggests that the investors have steadily paid more to buy the stock, which indicates increasing optimism and that the price will continue to rise. The volume balance indicator is also turning its head towards positive and indicates that more and more players are now buying the stock at rising prices. Further rise in stock price is expected.
Investtech's outlook (one to six months): Positive
The analyses are based on closing price as per November 12, 2019.
These instruments are traded in currency based on the Exchange or country they are listed on.
Written by

Analyst - Investtech
"Investtech analyses the psychology of the market and gives concrete trading suggestions every day."

Partner & Senior Advisor - Investtech
Investtech guarantees neither the entirety nor accuracy of the analyses. Any consequent exposure related to the advice / signals which emerge in the analyses is completely and entirely at the investors own expense and risk. Investtech is not responsible for any loss, either directly or indirectly, which arises as a result of the use of Investtechs analyses. Details of any arising conflicts of interest will always appear in the investment recommendations. Further information about Investtechs analyses can be found here disclaimer.
The content provided by Investtech.com is NOT SEC or FSA regulated and is therefore not intended for US or UK consumers.


 Oslo Børs
 Stockholmsbörsen
 Københavns Fondsbørs
 Helsingin pörssi
 World Indices
 US Stocks
 Toronto Stock Exchange
 London Stock Exchange
 Euronext Amsterdam
 Euronext Brussel
 DAX
DAX CAC 40
 Mumbai S.E.
 Commodities
 Currency
 Cryptocurrency
 Exchange Traded Funds
 Investtech Indices


