Statistikk på dobbel topp- og dobbel bunn-formasjoner Stockholmsbørsen 2003-2014
Forskningsresultater fra Investtech, 6. februar 2015.
Aksjer med langsiktige kjøpssignaler fra dobbel bunn-formasjoner har i gjennomsnitt steget 4,8% de neste tre månedene. Aksjer med salgssignaler fra langsiktige dobbel topp-formasjoner har i gjennomsnitt falt 2,2% de kommende tre månedene. Det viser en forskningsrapport fra Investtech basert på 11 år med data fra Stockholmsbørsen.
En dobbel topp-formasjon er en toppformasjon som markerer slutten på en oppgangsperiode. Formasjonen består av to topper som er omtrent like brede og like høye, se figur 1. Når en dobbel topp-formasjon dannes, gjenspeiler det at pessimismen hos investorene er økende og at aksjen innleder en fallende trend. Dobbel topp-formasjoner brukes spesielt for å forutsi vendinger i langsiktige markedstrender, men anvendes også på kortere sikt.
Formasjonen finnes i en omvendt versjon, dobbel bunn-formasjon, se figur 2. Dette er en bunnformasjon som markerer slutten på en nedgangsperiode. En dobbel bunn-formasjon signaliserer at optimismen hos investorene er økende og at aksjen innleder en stigende trend.

Figur 1: Salgssignal fra dobbel topp-formasjon.

Figur 2: Kjøpssignal fra dobbel bunn-formasjon.
I teknisk analyse-terminologi sier vi at brudd på en dobbel topp-formasjon utløser et salgssignal. Tilsvarende vil et brudd på en dobbel bunn-formasjon utløse et kjøpssignal.
Forskningssjef Geir Linløkken i Investtech har undersøkt hvilke kursbevegelser som har fulgt etter slike kjøps- og salgssignaler på Stockholmsbørsen over en periode på 11 år fra 2003 til 2014.
Til sammen identifiserte Investtechs datamaskiner 211 kjøpssignaler og 211 salgssignaler i perioden.

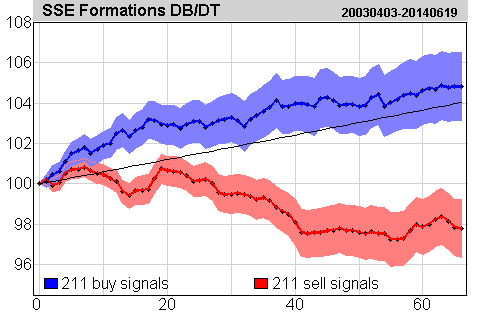
Figur 3: Kursutvikling ved kjøps- og salgssignaler fra hode-og-skuldre-formasjoner på Stockholmsbørsen identifisert av Investtechs automatiske algoritmer på langsiktige kursgrafer. Klikk på figuren for større versjon.
Grafen viser gjennomsnittlig kursutvikling 66 dager i etterkant av kjøpssignaler fra dobbel bunn-formasjoner og salgssignaler fra dobbel topp-formasjoner. Signalene utløses på dag 0. Kun dager da børsen er åpen inngår, slik at 66 dager tilsvarer cirka tre måneder. Kjøpssignaler er den blå kurven og salgssignaler den røde. Det skraverte området angir standardavviket til beregningene. Referanseindeksen er den sorte linjen.
Aksjer med kjøpssignaler har i gjennomsnitt etter tre måneder steget 4,8%, mens aksjer med salgssignaler har falt 2,2%.
Statistikken bygger på er relativt lite datagrunnlag. Resultatene fra Norge peker i samme retning, men er klarere for kjøpssignalene og mindre klare for salgssignalene. Vi ser derfor behov for å gjøre flere undersøkelser.
Du finner flere resultater og detaljer i forskningsrapporten.
Klikk her for å lese forskningsrapporten.
Keywords: Dobbel bunn,Dobbel topp,Kjøpssignal,Salgssignal,statistikk,Stockholmsbørsen.
Written by

Head of Research and Analysis
at Investtech
Hjelp og opplæring:
Kjøpssignal fra dobbel bunn-formasjon
Salgssignal fra dobbel topp-formasjon
Forskningsresultater:
Avkastning etter signaler fra rektangelformasjoner - Oslo Børs 1996-2014
Avkastning etter signaler fra rektangelformasjoner - Stockholmsbørsen 2003-2014
Avkastning etter signaler fra hode-og-skuldreformasjoner - Oslo Børs 1996-2014
Avkastning etter signaler fra hode-og-skuldre-formasjoner - Stockholmsbørsen 2003-2014
Avkastning etter signaler fra dobbel bunn- og dobbel topp-formasjoner - Oslo Børs 1996-2014
Avkastning etter signaler fra dobbel bunn- og dobbel topp-formasjoner - Stockholmsbørsen 2003-2014
"Investtech analyses the psychology of the market and gives concrete trading suggestions every day."

Partner & Senior Advisor - Investtech
Investtech guarantees neither the entirety nor accuracy of the analyses. Any consequent exposure related to the advice / signals which emerge in the analyses is completely and entirely at the investors own expense and risk. Investtech is not responsible for any loss, either directly or indirectly, which arises as a result of the use of Investtechs analyses. Details of any arising conflicts of interest will always appear in the investment recommendations. Further information about Investtechs analyses can be found here disclaimer.
The content provided by Investtech.com is NOT SEC or FSA regulated and is therefore not intended for US or UK consumers.


 Oslo Børs
 Stockholmsbörsen
 Københavns Fondsbørs
 Helsingin pörssi
 World Indices
 US Stocks
 Toronto Stock Exchange
 London Stock Exchange
 Euronext Amsterdam
 Euronext Brussel
 DAX
DAX CAC 40
 Mumbai S.E.
 Commodities
 Currency
 Cryptocurrency
 Exchange Traded Funds
 Investtech Indices


