Statistik dubbeltopp- och dubbelbotten-formation Stockholmsbörsen 2003-2014
Publicerad 2015-02-06
Långsiktiga köpsignaler från dubbelbotten-formationer har i genomsnitt stigit 4,8% de följande tre månaderna. Säljsignaler från långsiktiga dubbeltopp-formationer har i genomsnitt fallit 2,2% de följande tre månaderna. Det visar en forskningsrapport från Investtech baserad på 11 års data från Stockholmsbörsen.
En dubbeltopp-formation är en toppformation som markerar slutet på en uppgångsperiod. Formationen består av två toppar som är ungefär lika breda och höga, se figur 1. Säljsignal från en dubbeltopp-formation signalerar att pessimismen hos investerarna är ökande och att aktien inleder en fallande trend. Dubbeltopp-formationer används särskilt för att förutse vändningar i långsiktiga marknadstrender men också på kortare sikt.
Formationen finns i en omvänd version, dubbelbotten-formation, se figur 2. Det är en bottenformation som markerar slutet på en nedgångsperiod. Köpsignal från en dubbelbotten-formation signalerar att optimismen hos investerarna är ökande och att aktien inleder en stigande trend.

Figur 1: Säljsignal från dubbeltopp-formation.

Figur 2: Köpsignal från dubbelbotten-formation.
Inom teknisk analys säger vi att brott ned från en dubbeltopp-formation utlöser en säljsignal. Motsvarande utlöser ett brott upp en köpsignal.
Forskningschef Geir Linlökken har analyserat hur aktiekursen utvecklats efter sådana köp- respektive säljsignaler på Stockholmsbörsen under 11 år från 2003 till 2014.
Totalt identifierade Investtechs datorer 211 köpsignaler och 211 säljsignaler under den perioden.
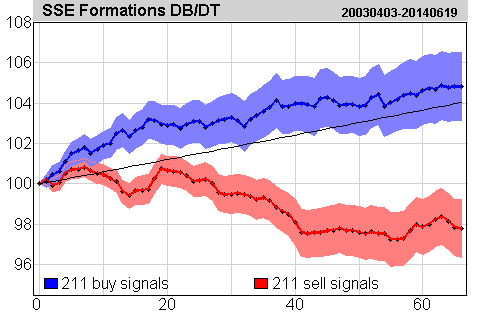
Figur 3: Kursutveckling köp- och säljsignaler dubbelbotten- och dubbeltopp-formationer på Stockholmsbörsen identifierade av Investtechs automatiska algoritmer på långsiktiga kursgrafer. Klicka på figuren för större bild.
Grafen visar genomsnittlig kursutveckling från signalen till och med 66 handelsdagar efter signalen, vilket motsvarar ungefär tre månader. Signalen utlöses på dag 0. Den blåa kurvan är köpsignaler och den röda är säljsignaler. Det färgade fältet omkring anger standardavvikelsen för beräkningarna. Den svarta linjen är referensindex.
Aktier som gav köpsignal steg i genomsnitt med 4,8 procent efter tre månader. Aktier som gav säljsignal föll i genomsnitt med 2,2 procent.
Statistiken bygger på relativt lite dataunderlag. Resultaten från Norge pekar i samma riktning men är starkare för köpsignaler och svagare för säljsignaler. Vi ser därför behov för att göra fler undersökningar.
Du hittar fler resultat och detaljer i forskningsrapporten. Klicka här för att läsa forskningsrapporten.
Keywords: dubbelbotten,dubbeltopp,Köpsignal,Säljsignal,statistik,Stockholmsbørsen.
Written by

Head of Research and Analysis
at Investtech
Utibildning och hjälp:
Köpsignal från dubbelbotten-formation
Säljsignal från dubbeltopp-formation
Forskningsresultat:
Avkastning etter signaler fra rektangelformasjoner - Oslo Børs 1996-2014
Avkastning efter signaler från rektangel-formationer - Stockholmsbörsen 2003-2014
Avkastning etter signaler fra hode-og-skuldreformasjoner - Oslo Børs 1996-2014
Avkastning efter signaler från huvudskuldra-formatijon - Stockholmsbörsen 2003-2014
Avkastning etter signaler fra dobbel bunn- og dobbel topp-formasjoner - Oslo Børs 1996-2014
Avkastning efter signaler från dubbelbotten- och dubbeltopp-formationer - Stockholmsbörsen 2003-2014
"Investtech analyses the psychology of the market and gives concrete trading suggestions every day."

Partner & Senior Advisor - Investtech
Investtech guarantees neither the entirety nor accuracy of the analyses. Any consequent exposure related to the advice / signals which emerge in the analyses is completely and entirely at the investors own expense and risk. Investtech is not responsible for any loss, either directly or indirectly, which arises as a result of the use of Investtechs analyses. Details of any arising conflicts of interest will always appear in the investment recommendations. Further information about Investtechs analyses can be found here disclaimer.
The content provided by Investtech.com is NOT SEC or FSA regulated and is therefore not intended for US or UK consumers.


 Oslo Børs
 Stockholmsbörsen
 Københavns Fondsbørs
 Helsingin pörssi
 World Indices
 US Stocks
 Toronto Stock Exchange
 London Stock Exchange
 Euronext Amsterdam
 Euronext Brussel
 DAX
DAX CAC 40
 Mumbai S.E.
 Commodities
 Currency
 Cryptocurrency
 Exchange Traded Funds
 Investtech Indices


