67% success for buy signals
Press release for Investtech.com, 16th August 2005.
A recent research report by Investtech.com shows that buy signals from rectangle formations for stock price charts are successful in 67% of cases.
In technical stock analysis one studies the investors' behaviour within the market, with the aid of charts. The aim is to predict future stock price development, in order to reduce the risk and increase the expected return for an investment. An important part of technical analysis is identifying particular geometrical patterns in stock price charts. The idea being that these describe the psychological state of the market, and therefore indicate the further direction of the stock price.
Investtech has since 1997 developed technical analysis systems, based on advanced mathematics and statistics. The company analyzes over 25,000 stocks on a daily basis. The analyses include specific recommendations based on charts with support and resistance, trend channels and formations, model portfolios and screening systems for stock selection. The company has developed automatic programs for identifying rectangle formations and the signals they trigger.
Investtech’s Head of Research, Mr Geir Linløkken, has in a recent research report analyzed the predictive value of buy signals triggered by rectangle formations. Mr Linløkken has based his research upon a dataset comprised of 629 identified buy signals, triggered by rectangle formations, during the period 1996 to 2004. These rectangles had an average length of 96 trading days, and an average height of 15 percent.
-We have seen some extremely interesting results, says Mr Linløkken, pointing out that as many as 67 percent of the signals triggered by rectangle formations have proved to be successful.
The research report from Investtech shows that only 7% of the signals met their targets during the day the signal was given and the following day, whilst 53% were successful during the course of half a formation length, and 76% over a period twice the length of the formation.
-The fact that there are as few as 7% after one day is positive, remarks Mr Linløkken, since this indicates that investors can receive large profits, even if they don’t buy in immediately. After half of the formation length, however, we see that over 50% of the signals have already met their targets, so neither should one wait too long before buying into such stocks.
Linløkken emphasises the fact that the dataset, which the report bases its conclusions upon, is seen as being representative for an average trading period, within an average market. The time period of 9 years is relatively long and there have been both rising and falling years, along with a number of periods with sideways development.
-Given the assumption that the investors' collective psychological behaviour in the stock market is constant over time, we believe that buy signals from rectangle formations will produce similar results in the future, concludes Mr Linløkken.
The complete research report can be found here.

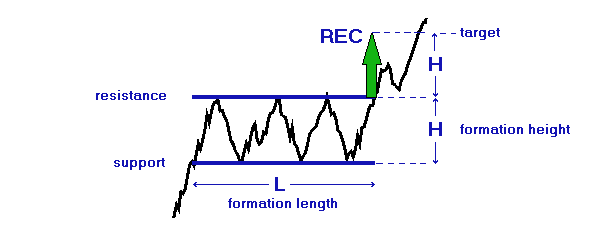
Figure 1. A rectangle formation with a buy signal. The stock price has for some time moved between two almost parallel and horizontal lines. The lower line is called the support line and the upper line is the resistance line. When either the support or resistance lines are broken, then the theory of technical analysis says that the stock price will continue in the same direction for at least as long as the rectangle is high, which is illustrated here by the green arrow. This level is denoted as the formation's target and should ideally be reached within a time period which is the same length as the formation.
Investtech guarantees neither the entirety nor accuracy of the analyses. Any consequent exposure related to the advice / signals which emerge in the analyses is completely and entirely at the investors own expense and risk. Investtech is not responsible for any loss, either directly or indirectly, which arises as a result of the use of Investtechs analyses. Details of any arising conflicts of interest will always appear in the investment recommendations. Further information about Investtechs analyses can be found here disclaimer.
The content provided by Investtech.com is NOT SEC or FSA regulated and is therefore not intended for US or UK consumers.


 Oslo Børs
 Stockholmsbörsen
 Københavns Fondsbørs
 Helsingin pörssi
 World Indices
 US Stocks
 Toronto Stock Exchange
 London Stock Exchange
 Euronext Amsterdam
 Euronext Brussel
 DAX
DAX CAC 40
 Mumbai S.E.
 Commodities
 Currency
 Cryptocurrency
 Exchange Traded Funds
 Investtech Indices