
 Oslo Børs
 Stockholmsbörsen
 Københavns Fondsbørs
Investeringsforeninger
Københavns Fondsbørs
Investeringsforeninger
 Helsingin pörssi
 World Indices
 US Stocks
US 30
Nasdaq 100
US 500
US Stocks
US 30
Nasdaq 100
US 500
 Toronto Stock Exchange
 London Stock Exchange
 Euronext Amsterdam
 Euronext Brussel
 DAX
SDAX
TECDAX
Frankfurt
CDAX
MDAX
Prime Standard
DAX
SDAX
TECDAX
Frankfurt
CDAX
MDAX
Prime Standard
 CAC 40
 Mumbai S.E.
National S.E.
Mumbai S.E.
National S.E.
 Commodities
 Currency
 Cryptocurrency
 Exchange Traded Funds
 Investtech Indices
Helsingin pörssi sharply lower
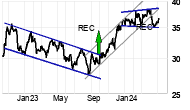
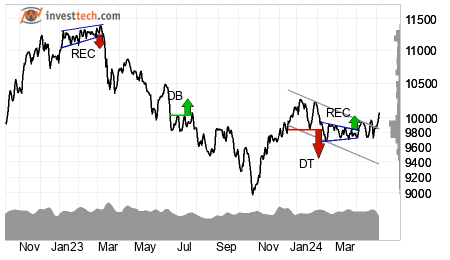 The market dropped considerably Thursday, and OMX Helsinki closed at 9726 points after a decline of 2.0 percent. The index has never lost more in one day since Mar 24. 2023, when it was down 2.4 percent. The index triggered a sell signal by the break down through the support at 9729 points in rectangle formation. A further drop to 9490 points within three months is indicated. 36 shares showed a gain and 125 showed a loss. 17 shares were unchanged and closed at the same price as the previous day. There was no trading in 3 shares. Total value of the trading volume for shares and primary capital certificates Thursday was approximately 0.8 billion. | |
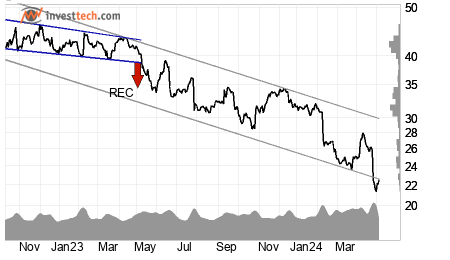 Neste OYJ fell sharply to close at 22.49 euro, down 13.0 percent. The previous time the stock lost this much was Jul 27. 2023, when it closed down 13.6 percent. The volume was also high. At session end it was bought and sold shares for about 111 million euro in the stock, which equals four times mean daily turnover. Nor does it look good technically. The stock is trend wise negative in the medium term, has resistance at 28.50 euro and a further decline is indicated.
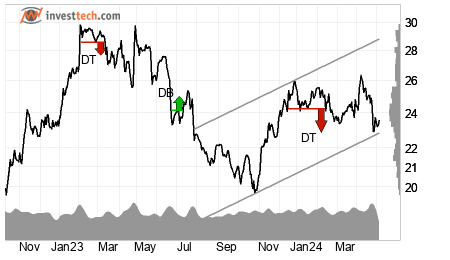
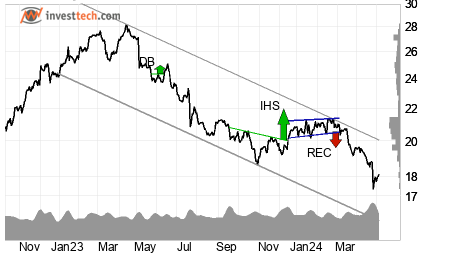 TietoEVRY ended with a steep loss of 7.6 percent and closed at 17.35 euro. The previous time the stock lost this much was Jul 21. 2023, when it closed down 8.9 percent. The stock has thereby closed down ten out of the past 13 days. The volume was also high. At session end it was bought and sold shares for about 22 million euro in the stock, which equals five times mean daily turnover. It does not look good technically either. The stock is trend wise negative in the medium term, has resistance at 18.60 euro and a further decline is indicated.
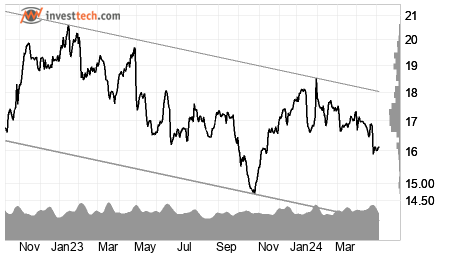 Kesko B fell sharply to close at 15.91 euro, down 5.4 percent. The stock has never lost more in one day since Apr 28. 2023, when it was down 9.3 percent. The stock has thereby closed down nine out of the past 12 days. The volume was also high. At session end it was bought and sold shares for about 32 million euro in the stock, which equals three times mean daily turnover. It does not look good technically either. The stock is trend wise negative in the medium term, has broken down through support at 16.20 euro and a further decline is indicated.
 Valmet closed at 22.92 euro after a steep drop of 5.8 percent. The stock has never lost more in one day since Mar 4. 2022, when it was down 6.3 percent. Nor does it look good technically. The stock is trend wise negative in the medium term, has broken down through support at 23.40 euro and a further decline is indicated.
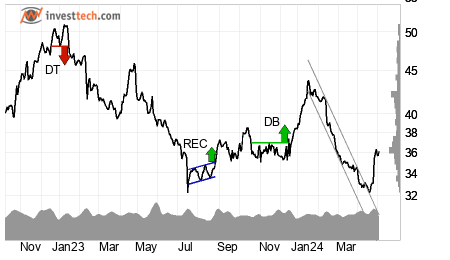 Orion B closed at 35.39 euro after a solid gain of 6.9 percent. The previous time the stock gained this much was Jul 13. 2022, when it closed up 9.2 percent. Technically it also looks good. The stock is trend wise negative in the medium term, but has marginally broken up through resistance at 35.00 euro.
|
Winners Thursday
| Nightingale Health Oyj B | 14.41% |
| Orion B | 6.92% |
| Orion A | 5.66% |
| Pihlajalinna | 2.86% |
| Detection Technology | 2.41% |
Losers Thursday
| Nanoform Finland Oyj | -21.77% |
| Exel Composites | -19.07% |
| Rush Factory Oyj | -16.13% |
| Neste OYJ | -13.00% |
| Ecoup Oyj | -12.23% |
Most traded Thursday
| Neste OYJ | 110.65 |
| Nordea Bank | 77.41 |
| UPM-Kymmene | 75.92 |
| Stora Enso R | 56.81 |
| Nokia Corporation | 50.10 |


Investtech guarantees neither the entirety nor accuracy of the analyses. Any consequent exposure related to the advice / signals which emerge in the analyses is completely and entirely at the investors own expense and risk. Investtech is not responsible for any loss, either directly or indirectly, which arises as a result of the use of Investtechs analyses. Details of any arising conflicts of interest will always appear in the investment recommendations. Further information about Investtechs analyses can be found here disclaimer.
The content provided by Investtech.com is NOT SEC or FSA regulated and is therefore not intended for US or UK consumers.
Head office
Strandveien 171366 Lysaker, Norway
Research department
Instituttveien 102007 Kjeller, Norway
×
