Global stocks: Two buy and one sell, Tesla at its lowest since January 2017
Published May 22, 2019
World indices are all over the place, some hitting all time highs like the National Stock Exchange (NSE) of India and others like S&P 500 and OMX Copenhagen 25 GI (OMXC25GI) hanging just above their short term supports. FTSE 100 on the other hand closed at 7328.92 points, looking sheepish and still trying to catch up with the rising trend channel. Similar is the case with AEX-index (Euronext Amsterdam) which has broken down through the rising trend channel and is hovering around the support of 553 and 545 points.
We have three interesting stocks from three different Exchanges which you can consider for the coming weeks. Two of them have good potential in the near term future and one is trading below its January 2017 low.
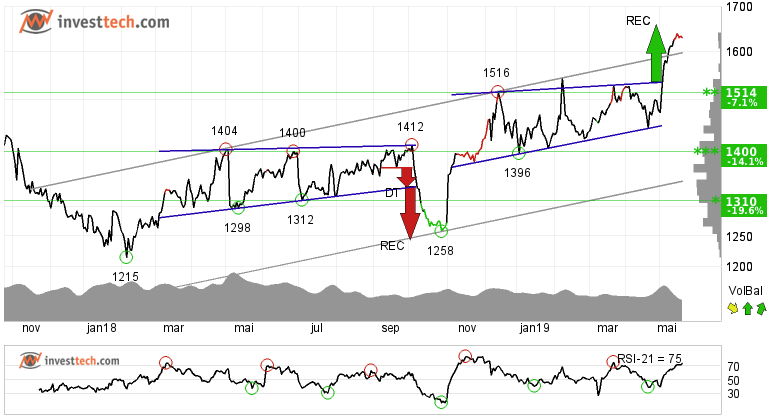
Smith & Nephew PLC (SN.L) Close: 1630.00
Investors have paid higher prices over time to buy in Smith & Nephew PLC and the stock has broken through the ceiling of the rising trend channel in the medium term. This signals increasing optimism among investors.
The stock recently gave a buy signal from a rectangle formation at 1536 pence. Further rise to 1659 or more is signalled. The stock has support at pence 1514.
The overall trend is supported by strong momentum and positive volume balance. The short term momentum of the stock is strongly positive, with RSI above 70. This indicates increasing optimism among investors and further price increase for Smith & Nephew PLC.
Investtech's outlook (one to six months): Buy
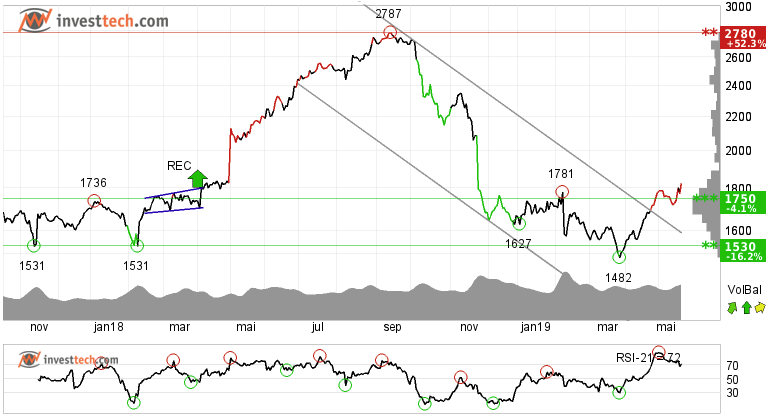
Rockwool International (ROCKB.CO) Close: 1825.00
Rockwool International has broken through the ceiling of a falling trend channel. This in the first place indicates that the rate of fall has been contained, or the development of a sideways trend. Established higher tops and higher bottoms in the same direction may lead to a change in trend to the positive side.
The stock is now trading above the resistance of 1750 danish kroner in the medium term charts. There is no clear resistance before 2780 kroner, or 52.3 % above last day's close. Hence the price can retrace itself to that level. On the downside there is support around 1750 and 1530 kroner.
The short term volume balance indicator is positive which indicates that buyers have been more aggressive than the sellers and are pushing the price higher. RSI is above 70 after a good price increase the past weeks. The stock has strong positive momentum and further increase is indicated. The stock is overall assessed as technically positive for the medium term.
Investtech's outlook (one to six months): Buy
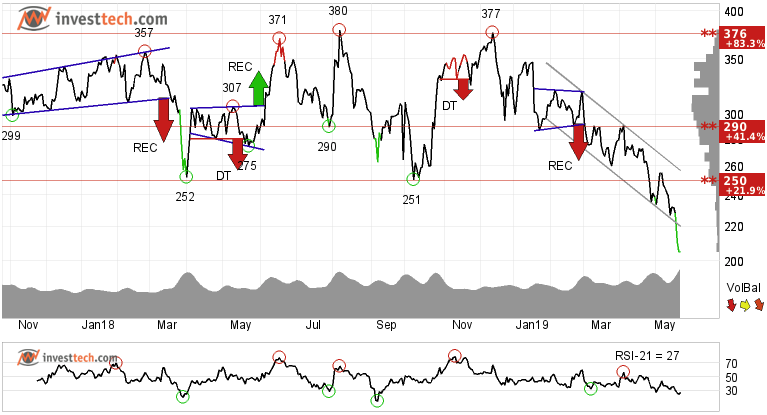
Tesla Inc (TSLA.US) Close: 205.08
Tesla Inc. has broken down through the falling trend channel on high volume in the medium term chart. This indicates that investors are somewhat skeptical about the future prospects of the company and are liquidating into cash to avoid any further loss to their capital. In the last one month itself the stock shed 25 per cent of its stock price value.
Volume balance is weak and negative which suggests an overweight of sellers over buyers. RSI-21 is below 30 level and indicates rising negative momentum in the stock.
However, in the long term, the stock is just above its support area of 202-186 dollars, which may give a reaction upwards. A break below this level can lead the stock to fall further down to 144 or lower. There is resistance around 250 dollars.
The stock is overall assessed as technically negative for the medium term. Please be conscious of the volatility risk in the stock with average monthly variation of over 20 per cent.
Investtech's outlook (one to six months): Sell
The analyses are based on closing price as per May 21, 2019
Note: These instruments are traded in currency based on the Exchange or country they are listed on.
Geschreven door

Analist
in Investtech
"Investtech analyseert de psychologie in de markt en geeft u iedere dag concrete trading-voorstellen."

Partner & Senior Advisor - Investtech
Investeringsaanbevelingen worden gedaan door Investtech.com AS ("Investtech"). Investtech garandeert geen volledigheid of juistheid van de analyses. Eventuele fouten in de aanbevelingen, koop- en verkoopsignalen en mogelijke negatieve gevolgen hiervan zijn geheel het risico van de belegger. Investtech neemt geen enkele verantwoordelijkheid voor verlies, direct of indirect, als gevolg van het gebruik van Investtechs analyses. Meer informatie omtrent Investtechs analyses kunt u vinden op disclaimer.
Investeringsaanbevelingen worden gedaan door Investtech.com AS ("Investtech"). Investtech garandeert geen volledigheid of juistheid van de analyses. Eventuele fouten in de aanbevelingen, koop- en verkoopsignalen en mogelijke negatieve gevolgen hiervan zijn geheel het risico van de belegger. Investtech neemt geen enkele verantwoordelijkheid voor verlies, direct of indirect, als gevolg van het gebruik van Investtechs analyses. Meer informatie omtrent Investtechs analyses kunt u vinden op disclaimer.


 Oslo Børs
 Stockholmsbörsen
 Københavns Fondsbørs
 Helsingin pörssi
 World Indices
 US Stocks
 Toronto Stock Exchange
 London Stock Exchange
 Euronext Amsterdam
 Euronext Brussel
 DAX
DAX CAC 40
 Mumbai S.E.
 Commodities
 Currency
 Cryptocurrency
 Exchange Traded Funds
 Investtech Indices


