Global stocks: Two buy candidates, US stocks
Published July 24, 2019
S&P 500 (SP500) developed positively on Tuesday and gained 0.68 percent to a close of 3005 points. S&P 500 is in a rising trend channel in the short, medium and long term. Rising trends indicate that the market experiences positive development and that buy interest among investors for the stocks is increasing. The index is nearing its highest close of 3014 points. On the downside there is support at 2946 points.
We write about two stocks that are listed on S&P 500. Main criteria for today's selection was liquidity which was set above 300 million dollars or above. Next step is to see only technically positive stocks. As we set the stock selection criteria, it gave us a list of 80 stocks. However, we are writing about two stocks today that top the list on the basis of overall score irrespective of sector.
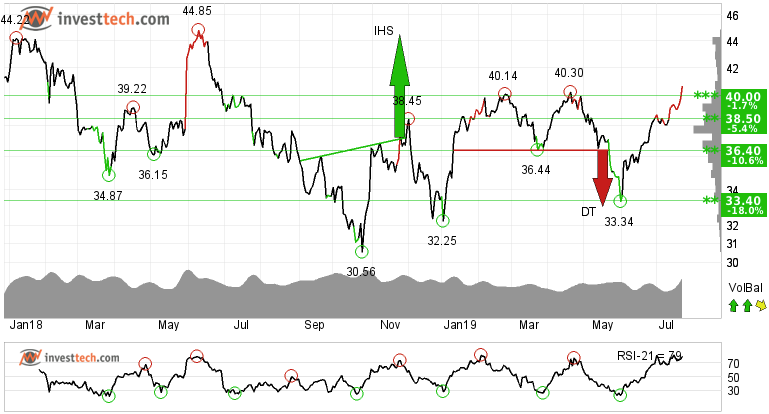
General Motors Company (GM.US500) Close: 40.71
General Motors Company does not show any clear trend in the medium term, but is inside rising trend channels both in short and long term charts. Investors have steadily paid more to buy the stock, which indicates increasing optimism and that the price may continue to rise.
The stock has risen by over 20 percent in the past two months and now has broken up through the resistance at 40.00 dollars. Next resistace is around 45 dollars. There is support between 40 and 38.50 levels.
Positive volume balance, with high volume on days of rising prices and low volume on days of falling prices, strengthens the stock in the short term. RSI above 70 shows that the stock has strong positive momentum in the short term. These indicators support underlying strength in the price. The stock is overall assessed as technically positive in the medium to long term.
Investtech's outlook (one to six months): Positive
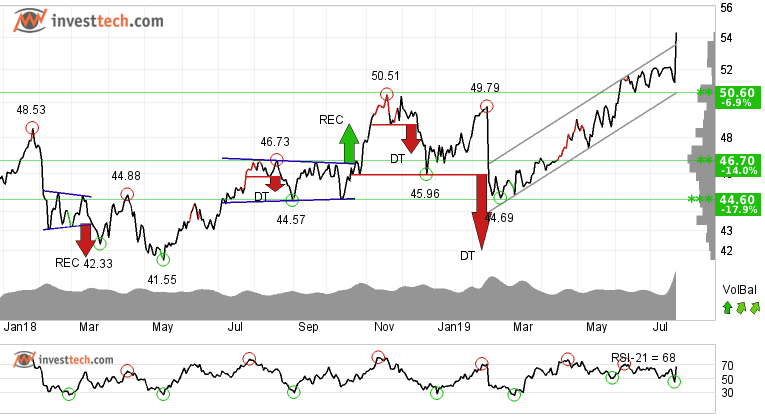
Coca-Cola (KO.US500) Close: 54.33
Investors have paid higher prices over time to buy in Coca-Cola and the stock price has broken through the ceiling of the rising trend channel both in the medium and long term. This signals increasing optimism among investors and indicates continued rise.
The stock is in all-time-high and now exploring new territory for itself. In case of any price correction, there is support around 52 and 50 levels.
Volume balance indicator is positive and suggests that there is clear higher weightage of buyers over sellers. Momentum indicator RSI is above 70 after a good price increase the past weeks. The stock has strong positive momentum and further increase is indicated.
Investtech's outlook (one to six months): Positive
The analyses are based on closing price as per July 23, 2019
Note: These instruments are traded in currency based on the Exchange or country they are listed on.
Geschreven door

Analist
in Investtech
"Investtech analyseert de psychologie in de markt en geeft u iedere dag concrete trading-voorstellen."

Partner & Senior Advisor - Investtech
Investeringsaanbevelingen worden gedaan door Investtech.com AS ("Investtech"). Investtech garandeert geen volledigheid of juistheid van de analyses. Eventuele fouten in de aanbevelingen, koop- en verkoopsignalen en mogelijke negatieve gevolgen hiervan zijn geheel het risico van de belegger. Investtech neemt geen enkele verantwoordelijkheid voor verlies, direct of indirect, als gevolg van het gebruik van Investtechs analyses. Meer informatie omtrent Investtechs analyses kunt u vinden op disclaimer.
Investeringsaanbevelingen worden gedaan door Investtech.com AS ("Investtech"). Investtech garandeert geen volledigheid of juistheid van de analyses. Eventuele fouten in de aanbevelingen, koop- en verkoopsignalen en mogelijke negatieve gevolgen hiervan zijn geheel het risico van de belegger. Investtech neemt geen enkele verantwoordelijkheid voor verlies, direct of indirect, als gevolg van het gebruik van Investtechs analyses. Meer informatie omtrent Investtechs analyses kunt u vinden op disclaimer.


 Oslo Børs
 Stockholmsbörsen
 Københavns Fondsbørs
 Helsingin pörssi
 World Indices
 US Stocks
 Toronto Stock Exchange
 London Stock Exchange
 Euronext Amsterdam
 Euronext Brussel
 DAX
DAX CAC 40
 Mumbai S.E.
 Commodities
 Currency
 Cryptocurrency
 Exchange Traded Funds
 Investtech Indices


