Global stocks: Big brands look promising
Published October 16, 2019
The mood of the international markets seems to be happy. S&P 500 is approaching its high of 3020 points (closing basis) and is only 25 points shy of that level. The broader market index developed positively on Tuesday, and gained 1.00 per cent to a close of 2996 points. This past week, the index has gained as much as 3.55 per cent. On the other hand, the German index Cdax-Gesamtindex (Perf) (CDAX) ended at 1173 points in Tuesday's trade, which is an increase of 1.14 per cent. The index has not closed higher since Jul 4. This past week, the CDAX has gained as much as 5.07 per cent.
Four interesting multinational stocks for our readers today; two sports brands that are trading at record high levels and two car brands that have positively broken out of price formations. The auto giants belong to the same parent organisation Volkswagen Group, and there may be a possibility that the price breakouts in both stocks coming at the same time are connected. However, that may not necessarily be true. Another common factor I discovered about the sportswear brands, is that they were founded in the same place, Herzogenaurach, Germany; one in 1948 and the other one in 1949. Interesting!
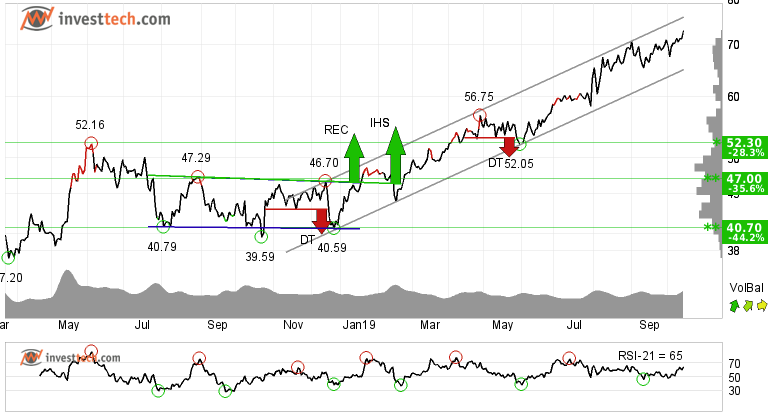
Puma AG (PUM.DE) Close: 72.95
Puma AG is showing great strength inside a rising trend channel in all time frames; short, medium and long term, and the stock has gained more than 80 per cent in the past 10 months. It had given a positive breakout from two price formations, rectangle and inverted head and shoulders formations, and has been rising since then.
The stock has broken above all resistance and is now trading at its peak. Hence there is no clear resistance in the stock. However, in case of a downward reaction, there is support around 65 euros in the short term.
Talking about the short term momentum, it is strong and positive. The positive volume balance indicator suggests that more and more investors are coming in when the stock price goes up while less and less people go out of the stock in case of any price reaction. This is adding more strength and the stock is overall assessed as technically positive in the medium to long term.
Investtech's outlook (one to six months): Positive
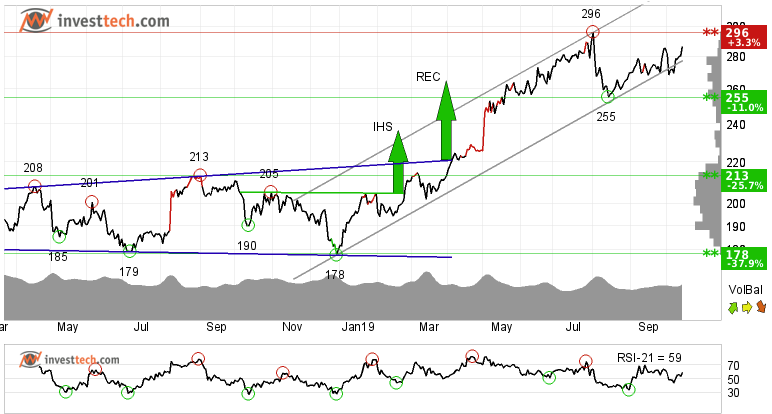
Adidas AG o.N. (ADS.DE) Close: 286.60
Investors have paid higher prices over time to buy Adidas AG o.N. and the stock is in a rising trend channel in the medium long term. This signals increasing optimism among investors and indicates continued rise. In the long term, the stock is hovering around the ceiling of the rising trend channel and is currently above the trend line. This adds extra weight to the rising trend channel.
There is resistance around 296 euros. If the price manages to break and close above that level, it will release a new buy signal and may initiate a fresh round of buying in the stock. On the downside, there is support between 279 and 269 euros.
The short term positive volume balance indicator suggests that volume is higher on days with rising prices and lower on days with falling prices. The short term momentum of the stock is strong and positive. This indicates increasing optimism among investors and further price increase for Adidas AG o.N.
Investtech's outlook (one to six months): Positive
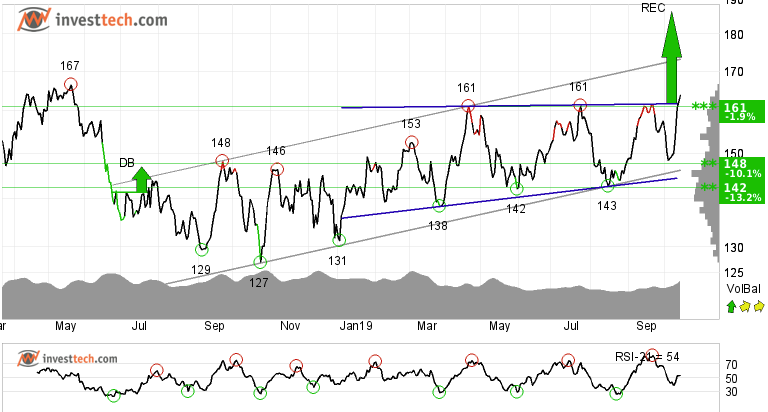
Volkswagen AG St o.N. (VOW.DE) Close: 164.10
Volkswagen AG St o.N. has broken out from an approximate horizontal trend channel both in the medium and long term charts. The stock has also given a buy signal from a rectangle formation both in the medium and long term charts and has broken above the resistance of 161 euros. Further rise to 186 euros or more is signalled.
There is support between 158 and 148 euros and resistance around 177 in the long term. A break above the resistance will give a positive signal and may lead to fresh buying in the stock.
The short term volume balance is positive, which strengthens the price formation. It indicates that more and more buyers are now interested in buying the stock as the price goes up. The RSI curve also shows signs of strength and is rising. All factors factored in indicates that this could be an early signal of the start of a rising trend for the price. The stock is overall assessed as technically positive for the short to medium term.
Investtech's outlook (one to six months): Positive
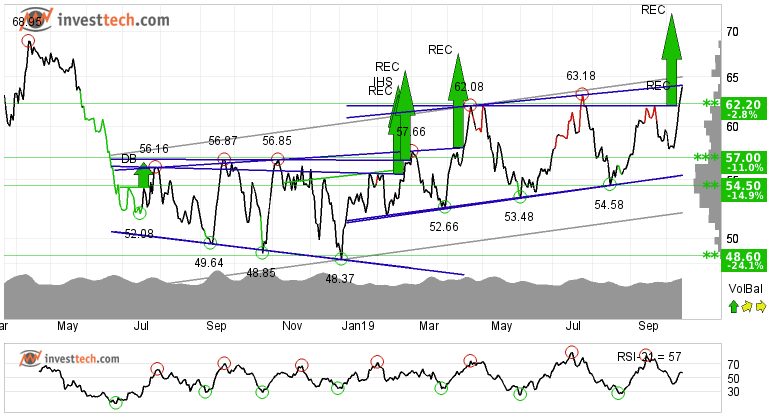
Porsche Automobil Hold (PAH3.DE) Close: 64.02
Porsche Automobil Holding SE is in a rising trend channel in the medium long term. This shows that investors over time have bought the stock at higher prices and indicates good development for the company. The medium term chart shows two rectangle formations, one is broken out and gives a price target of 72.09. The other rectangle formation is giving resistance to the price right at its ceiling. A break above that level, and more precisely above 65 euros (which is also the ceiling of the rising trend channel), will initiate a new buy signal.
Positive volume balance strengthens the stock in the short term. RSI is above 70 after a good price increase the past weeks. The stock has strong positive momentum and further increase is indicated.
Investtech's outlook (one to six months): Positive
The analyses are based on closing price as per October 15, 2019.
These instruments are traded in currency based on the Exchange or country they are listed on.
Geschreven door

Analist
in Investtech
"Investtech analyseert de psychologie in de markt en geeft u iedere dag concrete trading-voorstellen."

Partner & Senior Advisor - Investtech
Investeringsaanbevelingen worden gedaan door Investtech.com AS ("Investtech"). Investtech garandeert geen volledigheid of juistheid van de analyses. Eventuele fouten in de aanbevelingen, koop- en verkoopsignalen en mogelijke negatieve gevolgen hiervan zijn geheel het risico van de belegger. Investtech neemt geen enkele verantwoordelijkheid voor verlies, direct of indirect, als gevolg van het gebruik van Investtechs analyses. Meer informatie omtrent Investtechs analyses kunt u vinden op disclaimer.
Investeringsaanbevelingen worden gedaan door Investtech.com AS ("Investtech"). Investtech garandeert geen volledigheid of juistheid van de analyses. Eventuele fouten in de aanbevelingen, koop- en verkoopsignalen en mogelijke negatieve gevolgen hiervan zijn geheel het risico van de belegger. Investtech neemt geen enkele verantwoordelijkheid voor verlies, direct of indirect, als gevolg van het gebruik van Investtechs analyses. Meer informatie omtrent Investtechs analyses kunt u vinden op disclaimer.


 Oslo Børs
 Stockholmsbörsen
 Københavns Fondsbørs
 Helsingin pörssi
 World Indices
 US Stocks
 Toronto Stock Exchange
 London Stock Exchange
 Euronext Amsterdam
 Euronext Brussel
 DAX
DAX CAC 40
 Mumbai S.E.
 Commodities
 Currency
 Cryptocurrency
 Exchange Traded Funds
 Investtech Indices