Volume balance is a reliable indicator
Published 2 May 2019
A research report from Investtech based on 12 years of data from the National Stock Exchange in India shows that stocks with high volume balance have continued to rise and stocks with low volume balance have given significant negative excess return compared to benchmark.
Volume balance is the correlation between price change and volume. The indicator is calculated for 5, 22 and 66 days, corresponding to a week, a month and a quarter respectively.
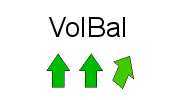
The indicator has values between –100 for maximally negative and +100 for maximally positive. The exact values are shown in the table in Investtech's chart pages, and visualized by arrows in the bottom right hand corner of the charts. Green arrows pointing upwards show that volume balance is positive and red arrows pointing downwards show that volume balance is negative. Yellow sideways arrows show neutral volume balance.

 High volume on increasing prices indicates that optimism is increasing and many investors pay more to secure stocks. Low volume on falling prices indicates that few investors will reduce the price to secure a sell and that they are comfortable keeping the stock. This is positive, and mirrored in a high volume balance.
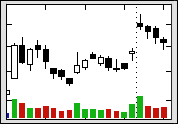
The green columns show volume on days with increasing prices, while the red show volume on days with falling prices. High green columns and low red ones give positive volume balance. This chart above is copied from Investtech's subscription service.
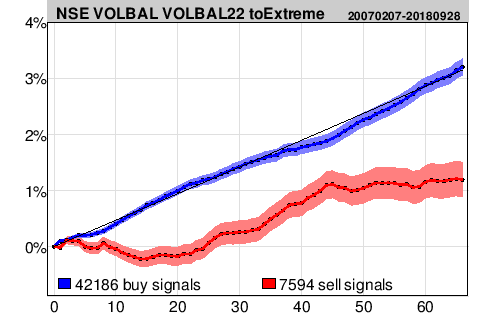
We have studied what happened in the 42,186 cases where the 22 day volume balance, volbal22, went above the 40 limit, defined as a buy signal, and the 7,594 cases where volbal22 fell below the -40 limit, defined as a sell signal.
The figure above shows price development in the first 66 days after volume balance signals vs average benchmark development for the whole period. The blue line is buy signals, the red line is sell signals and the black line is benchmark.
The table below shows annualized excess return following volbal22 signals. The figures are based on the quarterly figures, i.e. excess return 66 days (3 months) after the signal was triggered.
| Annualized excess return | |
| Buy signal volbal22 goes above 40 | 0,3 %p |
| Sell signal volbal22 falls below -40 | -8,3 %p |
%p: percentage points
The results show that stocks with negative volume balance have fallen over time. Statistically they continue to underperform vs benchmark. High volume balance in Investtech's charts is positive, but should be accompanied by signals from other indicators like rising trend or high momentum in order to indicate good excess return.
Investtech offers a number of stock picking tools, and using Stock selection you can set criteria for volume balance, allowing you to find for instance all stocks with volbal22 above 40. You can also set criteria for liquidity and volatility.
Please find more research results and details in the complete research report here.
Keywords: Buy signal,NSE,RSI,RSI-momentum,Sell signal,statistics.
Geschreven door

Hoofd research en analyse
in Investtech
Insight & Skills:
Pro tip:
Stock selection
Using the tool Stock selection you can set criteria for volbal22, allowing you to screen all stocks with volbal22 above 40 and liquidity of your choice.
Investeringsaanbevelingen worden gedaan door Investtech.com AS ("Investtech"). Investtech garandeert geen volledigheid of juistheid van de analyses. Eventuele fouten in de aanbevelingen, koop- en verkoopsignalen en mogelijke negatieve gevolgen hiervan zijn geheel het risico van de belegger. Investtech neemt geen enkele verantwoordelijkheid voor verlies, direct of indirect, als gevolg van het gebruik van Investtechs analyses. Meer informatie omtrent Investtechs analyses kunt u vinden op disclaimer.
Investeringsaanbevelingen worden gedaan door Investtech.com AS ("Investtech"). Investtech garandeert geen volledigheid of juistheid van de analyses. Eventuele fouten in de aanbevelingen, koop- en verkoopsignalen en mogelijke negatieve gevolgen hiervan zijn geheel het risico van de belegger. Investtech neemt geen enkele verantwoordelijkheid voor verlies, direct of indirect, als gevolg van het gebruik van Investtechs analyses. Meer informatie omtrent Investtechs analyses kunt u vinden op disclaimer.


 Oslo Børs
 Stockholmsbörsen
 Københavns Fondsbørs
 Helsingin pörssi
 World Indices
 US Stocks
 Toronto Stock Exchange
 London Stock Exchange
 Euronext Amsterdam
 Euronext Brussel
 DAX
DAX CAC 40
 Mumbai S.E.
 Commodities
 Currency
 Cryptocurrency
 Exchange Traded Funds
 Investtech Indices


