
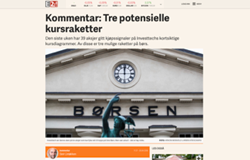
 Oslo Børs
 Stockholmsbörsen
 Københavns Fondsbørs
Investeringsforeninger
Københavns Fondsbørs
Investeringsforeninger
 Helsingin pörssi
 World Indices
 US Stocks
US 30
Nasdaq 100
US 500
US Stocks
US 30
Nasdaq 100
US 500
 Toronto Stock Exchange
 London Stock Exchange
 Euronext Amsterdam
 Euronext Brussel
 DAX
SDAX
TECDAX
CDAX
MDAX
Prime Standard
DAX
SDAX
TECDAX
CDAX
MDAX
Prime Standard
 CAC 40
 Mumbai S.E.
National S.E.
Mumbai S.E.
National S.E.
 Commodities
 Currency
 Cryptocurrency
 Exchange Traded Funds
 Investtech Indices
OMX Stockholm Basic Ma (SX55PI.ST)
Slotkoers: 2 322.54 (+11.68), 25 apr. 2025
Bekijk aanbeveling
Automatische technische analyse. Middellange termijn, 25 apr. 2025
OMX Stockholm Basic Materials PI zit in een vrijwel horizontale trend. Een voortzetting van deze trend valt te verwachten. De index heeft weerstand bij ongeveer 2380 punten. Volumtoppen komen goed overeen met koerstoppen en volumebodems komen goed overeen met koersbodems. Dit versterkt de index en verhoogt de kans voor een opwaartse uitbraak.Aanbeveling van een tot zes maanden: Bekijk aanbeveling
Partners

Investtech in the media
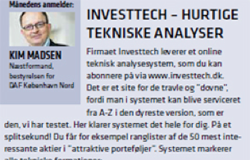
Digital Investor
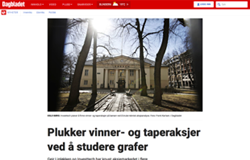
Dagbladet
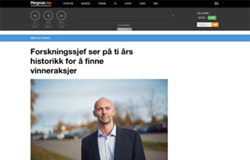
Hegnar
E24
Placera
Hur Investtech fungerar

Samla marknadsdata
Pris, volym, insynsinformation, företagshändelser etc.

Utför avancerad analys
Använder matematisk mönsterigenkänning, statistisk optimering och behavioural finance

Leverera angripbara insikter
Dagligen över aktierna, indexen och råvarorna som hör störst betydelse för din portfölj
Investtech i siffror
Erfarenhet
26 år
sedan 1997
Modellportfölj
14,5 %
i genomsnittlig årlig avkastning
Analys över
20+
börser
Rekommendationer av
30 000+
aktier, index, valuator, kryptovalutor och råvaror
Prijs
Investor
Everything you need to start planning your investment decisions.
SEK
340
SEK
249
/ month
Billed Annually: SEK 2990
Bestelling- Analyses van Euronext Amsterdam aandelen
- Mellomlange en lange termijn grafieken ⓘAnalyses for the medium and long term, respectively 1-6 months and 1-6 quarters investment perspective.
Mellomlange en lange termijn grafieken → - Concrete koop- en verkoopsignalen ⓘSpecific buy and sell signals for each stock.
- Health Check ⓘGet a detailed portfolio health check.
- Aandeel van de dag ⓘAandeel van de dag geeft u een selectie van technisch veelbelovende aandelen.
- Top50-rangering ⓘTop50 geeft u een lijst van 50 aandelen gerangschikt naar het sterkste koopsignaal.
Top50-rangering → - Kurs-alert ⓘYou may enter a price alert for a stock and be notified when the price reaches this level.
Kurs-alert → - Watchlist ⓘMaak een overzicht van de aandelen waarin u geïnteresseerd bent.
- Mijn portefeuilles ⓘGain better control of your investments with Investtech's portfolio system.
Mijn portefeuilles → - Modelportefeuille ⓘGoede bron van inspiratie voor lange termijn beleggers met een gemiddeld risicoprofiel.
Modelportefeuille → - Factor diagram ⓘThe Factor diagram visualises the stock's four most important qualities.
Factor diagram →
Most Popular
Trader
Take your investment decisions to another level with short term analyses and more advanced tools.
SEK
720
SEK
499
/ month
Billed Annually: SEK 5990
Bestelling- All Investor features
- +
- Korte termijn grafieken en analyses ⓘAnalyses for the short term, 1-6 weeks investment perspective.
Korte termijn grafieken en analyses → - Dagrapport ⓘHet rapport bevat dagelijkse aanbevelingen van Investtechs geautomatiseerde analyse-systeem.
- Trendsignalen ⓘThe Trend signals tool shows stocks that recently entered into a rising or falling trend.
Trendsignalen → - Omkeerpunten ⓘPivot points are tops and bottoms in the chart.
Omkeerpunten → - Key ratios ⓘKey financial indicators give information about a company's performance based on reported financial results for a given time period.
Key ratios → - Trading ideas ⓘTrading Ideas is an inspiration for short term investments.
Trading ideas → - Stay away portfolio ⓘThis Portfolio aims to show subscribers which stocks Investtech's analyses say to stay away from.
Stay away portfolio → - Trading-limieten ⓘTrading-limieten geeft u informatie over hoe een aandeel zich historisch heeft ontwikkelt in de loop van een handelsdag en hoeveel het aandeel statistisch beweegt.
Trading-limieten → - Volledig rapport ⓘComplete report is a full overview of available information about the company.
- Factor diagram ⓘThe Factor diagram visualises the stock's five most important qualities.
Factor diagram → - Candle sticks ⓘCandlestick analysis is the best tool for doing a detailed short term volume analysis.
Candle sticks →
Professional
A wide range of advanced selection tools and overall analysis to scale your investments.
SEK
1490
SEK
1040
/ month
Billed Annually: SEK 12490
Bestelling- All Trader features
- +
- Totaalanalyse ⓘOverall analysis for all time perspectives; long, medium and short term.
Totaalanalyse → - Aandelenselectie ⓘStock selection is likely the best stock picking tool Investtech offers. The most common usage is to select liquidity and time perspective, e.g. 50 % most liquid and short term.
Aandelenselectie → - Insider trade analysis ⓘAnalysis of insider trades is Investtech's alternative to fundamental analysis.
Insider trade analysis → - Hausse-indices ⓘThe Hausse indices are indicators of optimism.
Hausse-indices → - Result Analysis ⓘHow the stock price has moved before and after the company's publication of accounting figures.
Result Analysis → - Vergelijk aandelen ⓘVergelijk de prijsontwikkeling van een aandeel met die van 30.000 andere aandelen, grondstoffen en indices.
Vergelijk aandelen → - Handelsmogelijkheden ⓘThe Trading opportunities table is a stock picking tool. The table shows stocks with combinations of technical indicators that strongly indicate further rise or fall.
Handelsmogelijkheden → - Seizoenvariaties ⓘAnalysis of seasonal variations shows how a stock statistically has varied throughout the year.
Seizoenvariaties → - Chart view of ranking lists ⓘGraphic chart view of all ranking lists.
- Rangering van signalen ⓘAn overview of the latest buy and sell signals identified by InvesttechÕs systems. Signals from price patterns are assumed to indicate in which direction the majority of investors are moving.
Rangering van signalen → - Early warning ⓘDe Early Warning dienst van Investtech berekent welke koersniveaus (slotkoersen) bereikt moeten worden om de volgende handelsdag bepaalde koop- en verkoopsignalen te genereren.
Early warning →
Institutional
Access to all 30,000 stocks, commodities and currencies, suited for experienced investment strategists.
Get in touch
Contact - All Professional features
- +
- Alle 30.000 aandelen, grondstoffen en valuta ⓘAll 30,000 stocks, commodities and currencies.
- Zelfgedefiniëerde universen ⓘDefine your own universe of stocks.
- Alarmen ⓘOverview of the stocks in your universes that have triggered signals.
- Persoonlijke adviseur voor technische vragen ⓘContact your personal customer service representative with any technical questions you may have.
- Flexibele selectiecriteria ⓘWide range of flexible selection criteria.
Investeringsaanbevelingen worden gedaan door Investtech.com AS ("Investtech"). Investtech garandeert geen volledigheid of juistheid van de analyses. Eventuele fouten in de aanbevelingen, koop- en verkoopsignalen en mogelijke negatieve gevolgen hiervan zijn geheel het risico van de belegger. Investtech neemt geen enkele verantwoordelijkheid voor verlies, direct of indirect, als gevolg van het gebruik van Investtechs analyses. Meer informatie omtrent Investtechs analyses kunt u vinden op disclaimer.
Investeringsaanbevelingen worden gedaan door Investtech.com AS ("Investtech"). Investtech garandeert geen volledigheid of juistheid van de analyses. Eventuele fouten in de aanbevelingen, koop- en verkoopsignalen en mogelijke negatieve gevolgen hiervan zijn geheel het risico van de belegger. Investtech neemt geen enkele verantwoordelijkheid voor verlies, direct of indirect, als gevolg van het gebruik van Investtechs analyses. Meer informatie omtrent Investtechs analyses kunt u vinden op disclaimer.
Copyright Ⓒ 1997-2025 Investtech.com AS, Org nr 978 655 424 MVA Privacy Policy | Disclaimer | Sustainability Strategy
Hoofdkantoor
Strandveien 171366 Lysaker, Norway
Research-afdeling
Instituttveien 102007 Kjeller, Norway
×
