Support and Resistance: Break downwards through support is a sell signal
Published 24 October 2019
Stocks that have broken downwards through support have continued to underperform. These signals may be valuable input into a sell decision. This is in agreement with classic technical analysis theory.
According to technical analysis theory, support and resistance are among the most central concepts in technical analysis and can in theory be used to find good buy and sell levels.
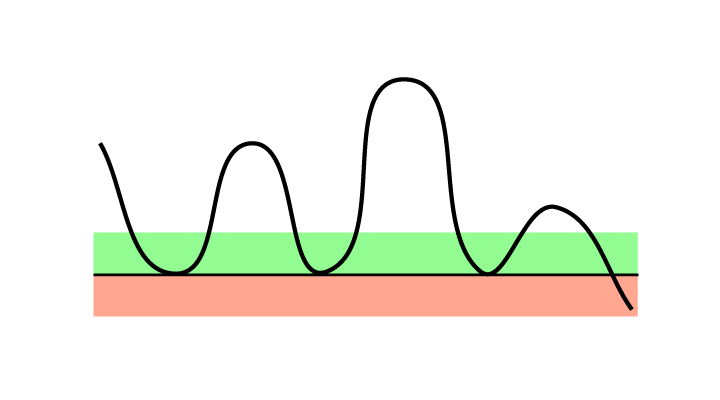
 Figure 1: A break downwards through support is a sell signal. Especially if volume is also increasing. The buyers who used to be at this level are gone, but there is still sales pressure in the stock.
In theory, a stock that recently broke downwards through a support level is expected to continue to fall. Selling or not buying such stocks help the investor avoid the continued fall. If the stock has fallen significantly since the break, a better price can be achieved by waiting for a reaction back.
Please note that stocks in rising trends often trigger false sell signals on breaks downwards through support. Investors who own such stocks should normally see a break downwards through a long term, strong support level, preferably on high volume, before selling.
Research results
We have studied return from Norwegian, Swedish, Danish and Finnish stocks following signals triggered by stocks' movements in relation to support and resistance levels in technical price charts. We used support and resistance levels automatically identified in Investtech’s medium term price charts. We had 23 years of data, from 1996 to 2018.
The chart below shows average price development following sell signals from stocks breaking downwards through support identified in Investtech’s medium term price charts. The signals are triggered on day 0. Only days when the exchange is open are included, so 66 days equal approximately three months. The thick blue line shows the development of buy signal stocks. The shaded areas are the standard deviation of the calculations. The thin blue line shows benchmark development in the same period as the buy signal stocks.
Figure 2: Return following sell signals from stocks with break downwards through support identified in Investtech’s medium term price charts. Thick blue line is buy signals, thin blue line is benchmark, the Nordic markets, 1996-2018.
| Annualised return (based on 66-day figures) | Norway | Sweden | Denmark | Finland | Weighted average |
| Sell signal | 4.5 % | 9.4 % | 2.8 % | 6.0 % | 6.8 % |
| Benchmark in same period | 8.6 % | 11.4 % | 7.7 % | 5.3 % | 9.5 % |
| Excess return sell signal | -4.2 pp | -2.1 pp | -4.8 pp | 0.8 pp | -2.7 pp |
pp = percentage point
The charts and tables show that stocks with sell signal from break downwards through support on average have risen in the following period. However, the rise is far smaller than average benchmark development in the same period.
Three months after the sell signal was triggered, the stocks had risen 1.7 per cent, equal to 0.7 percentage points less than benchmark. Annualised negative excess return was 2.7 percentage points.
The theoretically predicted fall statistically did not happen, but the stocks still underperformed compared to market. We suppose that a good way to implement these results in a trading strategy would be to sell stocks with these sell signals and rather buy stocks with better quantitative characteristics, such as buy signals from breaks upwards through resistance, as shown above.
The data set is very large, with 38,693 signals over a period of up to 23 years. Statistical t-value is 5.4, indicating high statistical significance.
Article on buy signals:
Support and Resistance: Break upwards through resistance is a buy signal
Read the research report here.
Geschreven door

Hoofd research en analyse
in Investtech
Research articles:
Support and Resistance: Research results cause doubt about buy signals
Support and Resistance: Profitable to buy stocks that are near resistance
Support and Resistance: Break upwards through resistance is a buy signal
Support and Resistance: Break downwards through support is a sell signal
Support and Resistance: Buy signal when stock is above support and lacks resistance
Support and Resistance: Good sell signals from stocks that are far below resistance and lack support
Please note:
Changes to Support and Resistance algorithms
Insight & Skills:
"Investtech analyseert de psychologie in de markt en geeft u iedere dag concrete trading-voorstellen."

Partner & Senior Advisor - Investtech
Investeringsaanbevelingen worden gedaan door Investtech.com AS ("Investtech"). Investtech garandeert geen volledigheid of juistheid van de analyses. Eventuele fouten in de aanbevelingen, koop- en verkoopsignalen en mogelijke negatieve gevolgen hiervan zijn geheel het risico van de belegger. Investtech neemt geen enkele verantwoordelijkheid voor verlies, direct of indirect, als gevolg van het gebruik van Investtechs analyses. Meer informatie omtrent Investtechs analyses kunt u vinden op disclaimer.
Investeringsaanbevelingen worden gedaan door Investtech.com AS ("Investtech"). Investtech garandeert geen volledigheid of juistheid van de analyses. Eventuele fouten in de aanbevelingen, koop- en verkoopsignalen en mogelijke negatieve gevolgen hiervan zijn geheel het risico van de belegger. Investtech neemt geen enkele verantwoordelijkheid voor verlies, direct of indirect, als gevolg van het gebruik van Investtechs analyses. Meer informatie omtrent Investtechs analyses kunt u vinden op disclaimer.


 Oslo Børs
 Stockholmsbörsen
 Københavns Fondsbørs
 Helsingin pörssi
 World Indices
 US Stocks
 Toronto Stock Exchange
 London Stock Exchange
 Euronext Amsterdam
 Euronext Brussel
 DAX
DAX CAC 40
 Mumbai S.E.
 Commodities
 Currency
 Cryptocurrency
 Exchange Traded Funds
 Investtech Indices


