
 Oslo Børs
 Stockholmsbörsen
 Københavns Fondsbørs
Investeringsforeninger
Københavns Fondsbørs
Investeringsforeninger
 Helsingin pörssi
 World Indices
 US Stocks
US 30
Nasdaq 100
US 500
US Stocks
US 30
Nasdaq 100
US 500
 Toronto Stock Exchange
 London Stock Exchange
 Euronext Amsterdam
 Euronext Brussel
 DAX
SDAX
TECDAX
Frankfurt
CDAX
MDAX
Prime Standard
DAX
SDAX
TECDAX
Frankfurt
CDAX
MDAX
Prime Standard
 CAC 40
 Mumbai S.E.
National S.E.
Mumbai S.E.
National S.E.
 Commodities
 Currency
 Cryptocurrency
 Exchange Traded Funds
 Investtech Indices
Investtech Research: Death Cross, statistical results
Published 2 November 2022
Written by senior researcher Asbjørn Taugbøl, head of R&D Geir Linløkken and senior researcher Fredrik Tyvand.
Abstract:
Moving average is one of the oldest and most used indicators in technical analysis. A common strategy is watching when the 50-day moving average crosses below the 200-day moving average. This is called a Death Cross and is said to signal falling prices. We have identified Death Cross signals in the Nordic markets in the period 2008 - 2020 and studied price development following these signals. This work was supported by the Norwegian Research Council.
Sell signals from moving average
With support from the Norwegian Research Council, we have conducted a study into price development following signals from the moving average indicator. Usually a 50-day moving average and a 200-day moving average are defined and signals triggered when these cross. In this study we have looked at what happens following so called Death Cross signals, where the short term average crosses below the long term average. The data are every listed stock in the Nordic countries in the period 1 January 2008 to 31 December 2020. This is a period of 13 years with both long uptrends, downtrends and sideways movements. In the statistical results, we have studied price development in the 3 months (66 days) following the signals. The results were compared to market development in the same period after the signals in order to calculate excess return.
About the analyses
We used the 50-day moving average as short term indicator and the 200-day moving average as long term indicator. A sell signal was identified when the short term average crossed below the long term average.
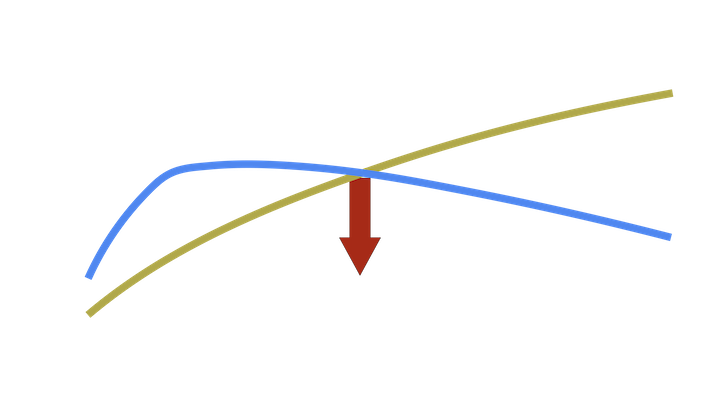 Death Cross: Short term average crossing below long term average shows that the price in a given shorter time period has fallen more than in a given longer time period.
Analysis results for Death Cross
Analyses were conducted to identify signals and calculate absolute and relative return for these. 4452 Death Cross sell signals were identified. This is a good basis for statistical analyses.
Average return for the sell signals is shown in the chart below.
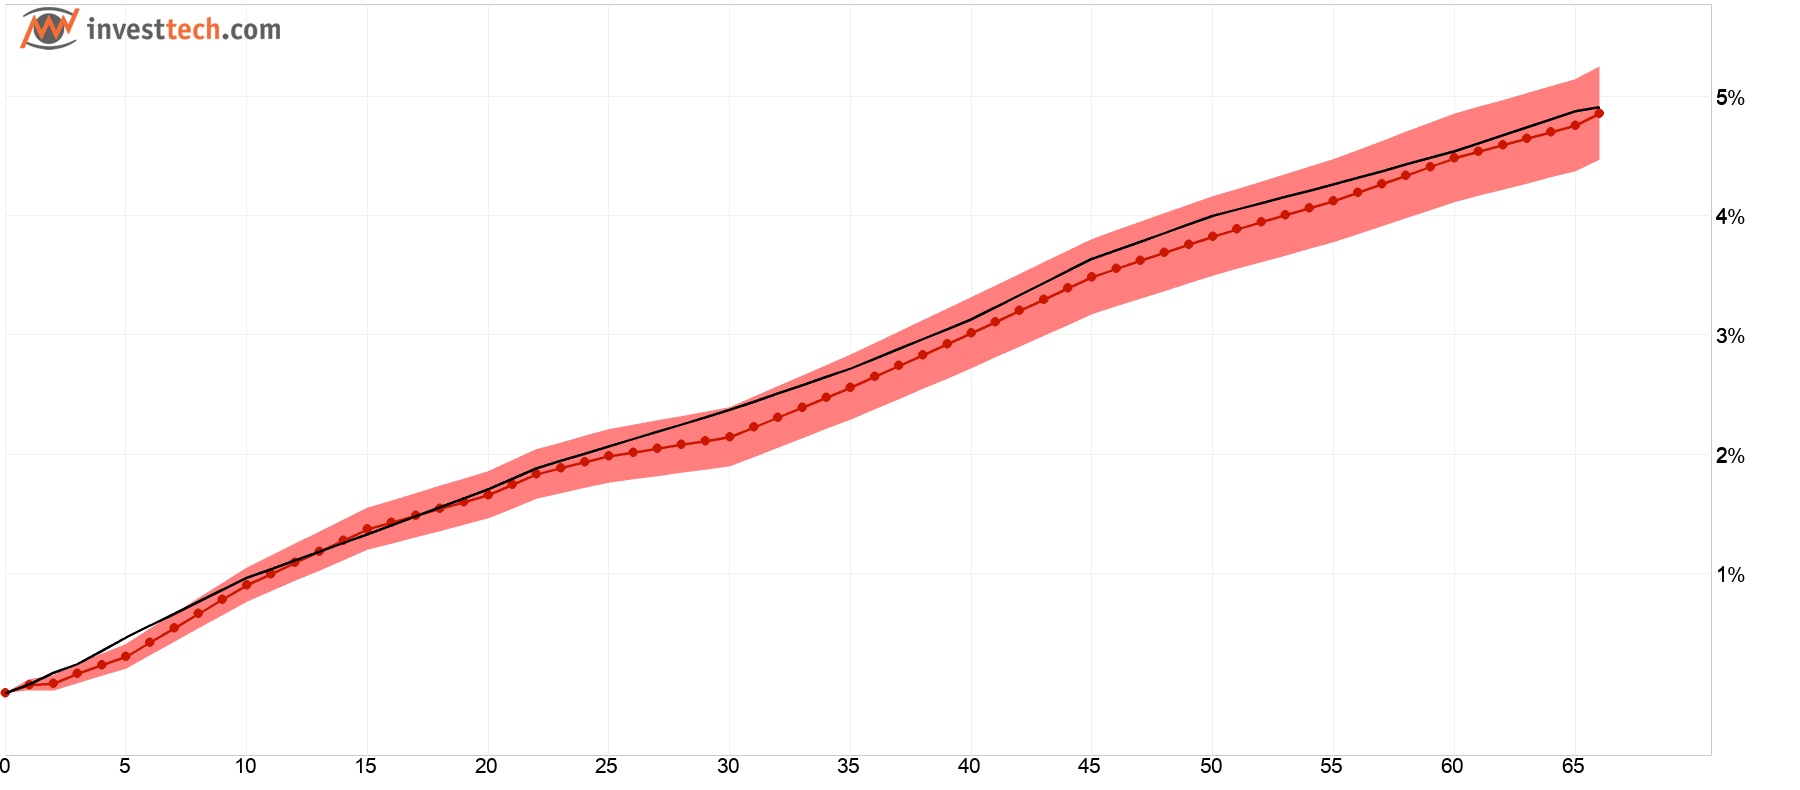
Figure 1: Average return following Death Cross sell signals, i.e. where 50-day short term moving average crossed below the 200-day long term moving average. Red line is signal stocks, black line is benchmark. Shaded red area indicates standard deviation of signal stocks. The Nordic markets 2008-2020.
| Return and relative return after 66 days | |
| Sell signal | 4.86 % |
| Benchmark in same period | 4.91 % |
| Excess return sell signal | -0.05 %p |
pp = percentage point, i.e. the arithmetic difference of the percentage returns.
For the Nordic markets combined, we see that stocks with sell signals did not develop any weaker than benchmark. The market on average rose during the signal period, so the signals did not indicate future weak market development either. Consequently, the sell signals had no predictive power. This indicates that this kind of sell signal should not be part of a trading strategy.
Conclusion
Death Cross signals (50-day moving average crossing below 200-day moving average) had low signal value. Such signals are not suited for use in a trading strategy.
Please find results for buy signals from moving average and more details in the research report here (in Norwegian, Professional subscription required).
Literature
- Geir Linløkken. Investtech Research: Return following signals from price formations in stock prices, Nordic markets 1996-2018, Investtech 2020.
- Geir Linløkken, Asbjørn Taugbøl, Fredrik Tyvand. Investtech-forskning: Støtte og motstand - signalstatistikk Norden 2019 og 2020, Investtech 2021. In Norwegian only.
- Geir Linløkken, Asbjørn Taugbøl, Fredrik Tyvand. Investtech-forskning: Innsidehandler - signalstatistikk Norge, Sverige og Danmark 2019 og 2020, Investtech 2021. In Norwegian only.
- Geir Linløkken. Volumbalanse - signalstatistikk nordiske markeder 1996 til 2018, Investtech 2020. In Norwegian only.
- Geir Linløkken, Asbjørn Taugbøl, Fredrik Tyvand. Investtech Research: Return following testing of and breaks through support and resistance in stock prices, the Nordic markets, 1996-2018, Investtech 2019.
- Asbjørn Taugbøl. Stocks in rising trends have given excess return in the Nordic markets, Investtech 2019.
- Asbjørn Taugbøl. Trend signals better than theory suggests, Investtech 2019.
- Geir Linløkken. Innsidekjøp som indikator for videre kursutvikling i aksjen, Investtech 2019. In Norwegian only.
- Geir Linløkken. RSI is a good momentum indicator, Investtech 2019.
- Geir Linløkken. Investtech Research: Return following signals from rectangle formations in stock prices - medium term, Nordic markets, 1996-2018, Investtech 2019.
- Geir Linløkken and Steffen Frölich. Technical Stock Analysis - for lower risk and increased return. Investtech.com, 2001.
- John J. Murphy. Technical Analysis of the Financial Markets. New York Institute of Finance, 1999.
- Glendrange, G., & Tveiten, S. (2016). Testing the Performance of Simple Moving Average With the Extension of Short Selling. University of Agder, 2016 School of Business and Law Department of Economics and Finance, 1-63.
- James, Jr, F. E. (1968, September). Monthly Moving Averages--An Effective Investment Tool? Cambridge University Press, 3(3), 315-326.
- Ms. Satav, S., & Dr. Apte, N. (2020, July). THE MOVING AVERAGE CROSSOVER STRATEGY: A STUDY. Inspira- Journal of Modern Management & Entrepreneurship (JMME), 10(3), 141-146.
- Praekhaow, P. (2010, June). Determination of Trading Points using the Moving Average Methods. Department of Mathematics, Faculty of Science, King Mongkuts University of Technology Thonburi, Bangkok 10140, Thailand, 1-5.
Keywords: Forskningsresultater,Glidende snitt,Kjøpssignal,Salgssignal.
Geschreven door

Analist
in Investtech
"Investtech analyseert de psychologie in de markt en geeft u iedere dag concrete trading-voorstellen."

Partner & Senior Advisor - Investtech


Investeringsaanbevelingen worden gedaan door Investtech.com AS ("Investtech"). Investtech garandeert geen volledigheid of juistheid van de analyses. Eventuele fouten in de aanbevelingen, koop- en verkoopsignalen en mogelijke negatieve gevolgen hiervan zijn geheel het risico van de belegger. Investtech neemt geen enkele verantwoordelijkheid voor verlies, direct of indirect, als gevolg van het gebruik van Investtechs analyses. Meer informatie omtrent Investtechs analyses kunt u vinden op disclaimer.
Investeringsaanbevelingen worden gedaan door Investtech.com AS ("Investtech"). Investtech garandeert geen volledigheid of juistheid van de analyses. Eventuele fouten in de aanbevelingen, koop- en verkoopsignalen en mogelijke negatieve gevolgen hiervan zijn geheel het risico van de belegger. Investtech neemt geen enkele verantwoordelijkheid voor verlies, direct of indirect, als gevolg van het gebruik van Investtechs analyses. Meer informatie omtrent Investtechs analyses kunt u vinden op disclaimer.
Hoofdkantoor
Strandveien 171366 Lysaker, Norway
Research-afdeling
Instituttveien 102007 Kjeller, Norway