
 Oslo Børs
 Stockholmsbörsen
 Københavns Fondsbørs
Investeringsforeninger
Københavns Fondsbørs
Investeringsforeninger
 Helsingin pörssi
 World Indices
 US Stocks
US 30
Nasdaq 100
US 500
US Stocks
US 30
Nasdaq 100
US 500
 Toronto Stock Exchange
 London Stock Exchange
 Euronext Amsterdam
 Euronext Brussel
 DAX
SDAX
TECDAX
Frankfurt
CDAX
MDAX
Prime Standard
DAX
SDAX
TECDAX
Frankfurt
CDAX
MDAX
Prime Standard
 CAC 40
 Mumbai S.E.
National S.E.
Mumbai S.E.
National S.E.
 Commodities
 Currency
 Cryptocurrency
 Exchange Traded Funds
 Investtech Indices
Global stocks: FAANG stocks, what to expect in near future
Published June 05, 2019
The big tech giants were sent down on Monday when the flare of planned investigations by Justice Department and Federal Trade Commission set out. In Tuesday's trade most of them managed to recover some of the losses from Monday as the broader market went up by more than two percent and closed higher. To look at the bigger economic picture, prospect of more tariffs and declining global trade continue to scare world economies. Sharp dip in oil prices (down by 17 percent) since the end of April this year has left traders and investors in doubt.
Our focus today is the technical chart of big technological gigants where investors and funds hold large stakes, how the charts look like in the medium and long term and what can we expect in the coming months.
Since topping out in May, all the FAANG stocks are down between 8 and 18 percent. Except for Google (Alphabet Inc.) none of them could manage to even touch their previous tops established last year in summer. The momentum in most of them is either negative (RSI 21 below 30) or is very weak. Volume balance indicator also seems to be supporting the falling price. Overall the medium term future does not look very promising, rather dull.
Further research has been done by Investtech on how stocks have performed when positioned in a rising, falling or sideways trend stocks. You can read about the research here. Also read about the research on Momentum indicator RSI here.
Facebook Inc (FB.US) Close: 167.50
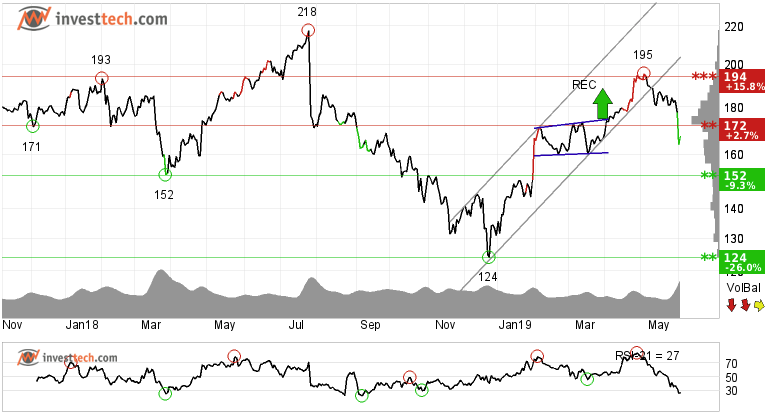
Facebook Inc. has broken down through the rising trend channel in the medium term. In the first place this indicates a slower rising pace or development of more of a sideways trend. However, the price has broken through the support sharply and has fallen by 14 percent since its recent high made early last month. Next support is now at 152 dollars (medium term) and 124 dollars (long term) respectively. Resistance is at 172 and 194 dollars.
The overall trend is supported by strong negative momentum and negative volume balance. This indicates increasing pessimism among investors and further price decline for Facebook Inc.
Investtech's outlook (one to six months): Negative
Apple (AAPL.US) Close: 179.64
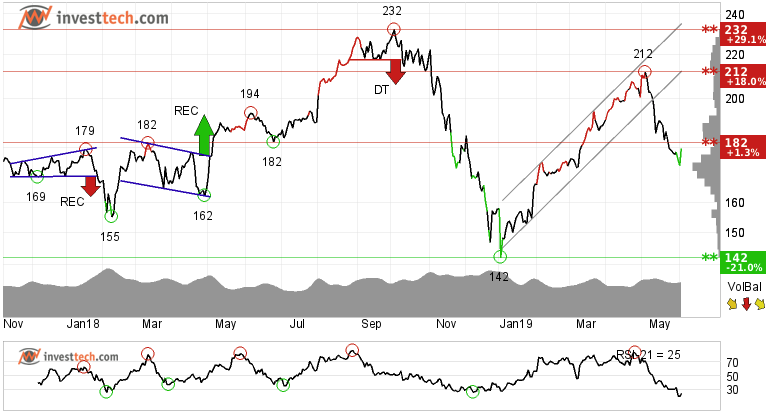
Apple has broken down through the rising trend channel and the support around 182 dollars in the medium term chart is now broken. On the other hand, long term trend channel is still intact and there is support around 142-140 dollars. A break below that level may lead to freah selling in the market. Resistance is around 182-187 and 200 dollars in the short term.
Negative momentum indicates that the rate of fall in price is high. Along with negative volume balance, both indicators weigh the stock down.
Investtech's outlook (one to six months): Negative
Amazon.com (AMZN.US) Close: 1729.56
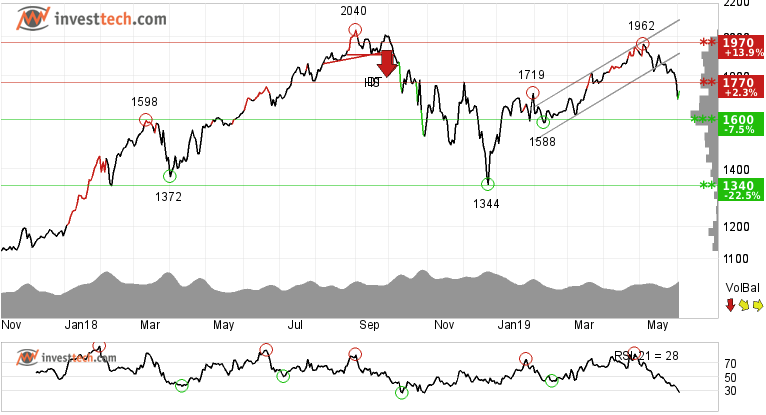
Like above analyzed stocks, Amazon.com chart looks no different. In The stock failed to breach its last year's high and rather reversed after establishing a top around 1962 dollars. The stock went down by 11.8 percent in the matter of one month. With support around 1770 dollars being broken, this level will now work as a resistance in case of any price reaction upwards. Next support level is not before 1600 and then further down to 1340 dollars.
Investtech's outlook (one to six months): Weak Negative
NetFlix Inc (NFLX.US) Close: 353.40
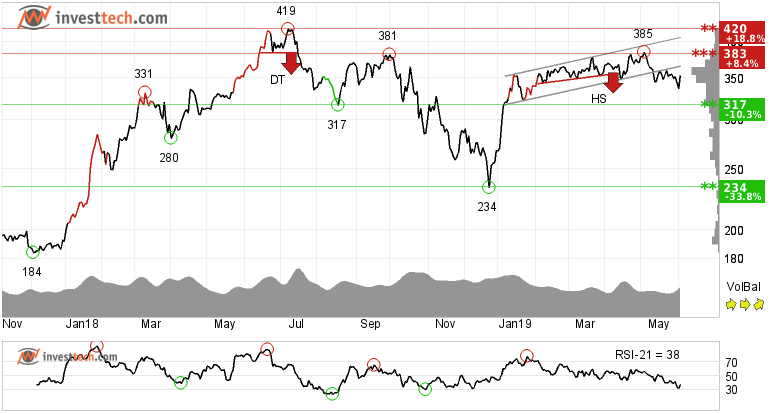
Netflix Inc. made two failed attempts to go beyond last year's high in July. The stock has fallen through the rising trend channel and is now trading more sideways. Unlike other FAANG stocks, Netflix Inc. has fallen by only 8.3 percent from its May high this year.
The stock has resistance around 383-385 dollars and further at 419 level. There is support by 317 dollars. Volume balance is neutral which indicates indecision among buyers and sellers to which direction they wish to take the stock. The stock is overall assessed as technically neutral in the medium to long term until one of the levels are broken on either side.
Investtech's outlook (one to six months): Watch
Alphabet Inc (GOOG.US) Close: 1053.05
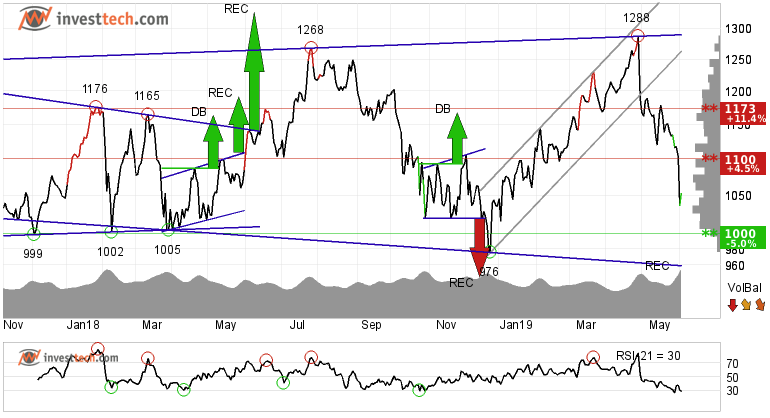
Alphabet Inc has broken the rising trend channel in the medium and long term and reacted strongly down. For the time being, it is difficult to say anything about the future trend direction. The stock is moving within a rectangle formation between support at 972 and resistance at 1298. A decisive break through one of these levels indicates the new direction for the stock. The stock has support at dollar 1000 and resistance at dollar 1106.
Negative volume balance weakens the stock in the short term. The short term momentum of the stock is strongly negative, with RSI below 30. This indicates increasing pessimism among investors.
Investtech's outlook (one to six months): Watch
Note: The Norwegian oil fund alone holds a combined stake of 4.58 percent in all five stocks at the time I write this article. Source nbim.no
| FAANG stocks | Total Investment (USD) | Ownership (%) |
| FB | 3.124 billion | 0.83 |
| AMZN | 6.325 billion | 0.86 |
| AAPL | 7.245 billion | 0.97 |
| NFLX | 1.172 billion | 1.00 |
| GOOG | 6.656 billion | 0.92 |
The analyses are based on closing price as per June 04, 2019
Note: These instruments are traded in currency based on the Exchange or country they are listed on.
Geschreven door

Analist
in Investtech
"Investtech analyseert de psychologie in de markt en geeft u iedere dag concrete trading-voorstellen."

Partner & Senior Advisor - Investtech


Investeringsaanbevelingen worden gedaan door Investtech.com AS ("Investtech"). Investtech garandeert geen volledigheid of juistheid van de analyses. Eventuele fouten in de aanbevelingen, koop- en verkoopsignalen en mogelijke negatieve gevolgen hiervan zijn geheel het risico van de belegger. Investtech neemt geen enkele verantwoordelijkheid voor verlies, direct of indirect, als gevolg van het gebruik van Investtechs analyses. Meer informatie omtrent Investtechs analyses kunt u vinden op disclaimer.
Investeringsaanbevelingen worden gedaan door Investtech.com AS ("Investtech"). Investtech garandeert geen volledigheid of juistheid van de analyses. Eventuele fouten in de aanbevelingen, koop- en verkoopsignalen en mogelijke negatieve gevolgen hiervan zijn geheel het risico van de belegger. Investtech neemt geen enkele verantwoordelijkheid voor verlies, direct of indirect, als gevolg van het gebruik van Investtechs analyses. Meer informatie omtrent Investtechs analyses kunt u vinden op disclaimer.
Hoofdkantoor
Strandveien 171366 Lysaker, Norway
Research-afdeling
Instituttveien 102007 Kjeller, Norway