
 Oslo Børs
 Stockholmsbörsen
 Københavns Fondsbørs
Investeringsforeninger
Københavns Fondsbørs
Investeringsforeninger
 Helsingin pörssi
 World Indices
 US Stocks
US 30
Nasdaq 100
US 500
US Stocks
US 30
Nasdaq 100
US 500
 Toronto Stock Exchange
 London Stock Exchange
 Euronext Amsterdam
 Euronext Brussel
 DAX
SDAX
TECDAX
Frankfurt
CDAX
MDAX
Prime Standard
DAX
SDAX
TECDAX
Frankfurt
CDAX
MDAX
Prime Standard
 CAC 40
 Mumbai S.E.
National S.E.
Mumbai S.E.
National S.E.
 Commodities
 Currency
 Cryptocurrency
 Exchange Traded Funds
 Investtech Indices
Global stocks: Breakout in big stocks both in the medium and long term
Published November 20, 2019
S&P 500 (SP500) moved more or less horizontally on Tuesday and closed at 3120 points (-0.06 per cent). The index thereby reversed down after five days of gains. The index is around its all time high and the strong momentum supports the rising index.
We have three big American stocks for you that have given breakout from rectangle formations in both the medium and the long term charts.
United Health Grp. (UNH.US500) Close: 274.23
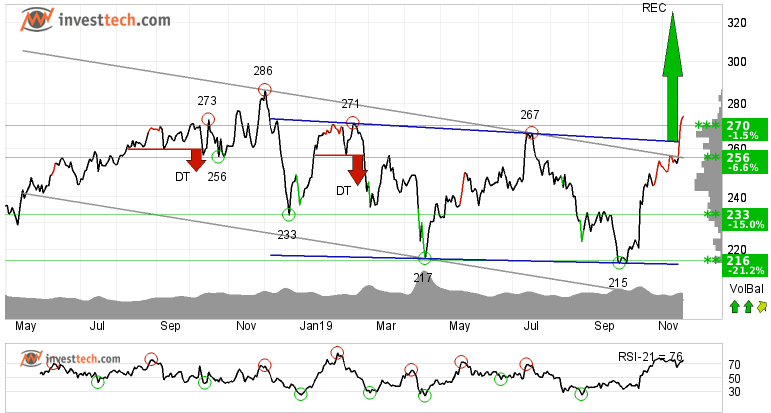
United Health Grp. has broken the ceiling of a falling trend in the medium term, which indicates a slower initial falling rate. The stock has given several positive signals; breakout through the ceiling of the rising trend channel in the short term, breakout from rectangle formations by a break up through the resistance at 263 dollars both in the medium and long term charts. Further rise to 326 dollars or more is signalled.
The stock has broken up through the resistance at 270 dollars. This predicts a further rise. In case of negative reactions, there will now be support at 270 and 250 levels.
Positive volume balance indicates that buyers are aggressive while sellers are passive, and strengthens the stock. RSI is above 70 after a good price increase the past weeks. The stock has strong positive momentum and further increase is indicated. However, particularly for big stocks, high RSI may be a sign that the stock is overbought and that there is a chance of a reaction downwards. The stock is overall assessed as technically positive for the medium term.
Investtech's outlook (one to six months): Positive
Bank of America Corp. (BAC.US500) Close: 32.94
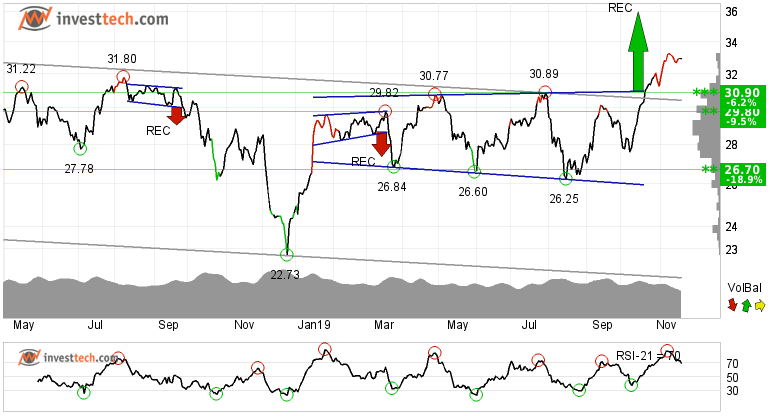
A sideways price movement that started in January this year is finally broken. Bank of America Corp. has given a buy signal from a rectangle formation both in the medium and long term charts. Further rise to 35.98 dollars or more is signalled. The stock has also broken up through resistance at 30.90 dollars and further rise in the stock is expected. There is no resistance in the price chart and further rise is indicated. In case of a negative reaction, the stock has support at 30.90 dollars.
The current movement has strong momentum as the momentum indicator RSI is above 70. It suggests that the investors have steadily paid more to buy the stock, which indicates increasing optimism and that the price will continue to rise. Further rise in stock price is expected.
Investtech's outlook (one to six months): Positive
JP Morgan Chase (JPM.US500) Close: 130.58
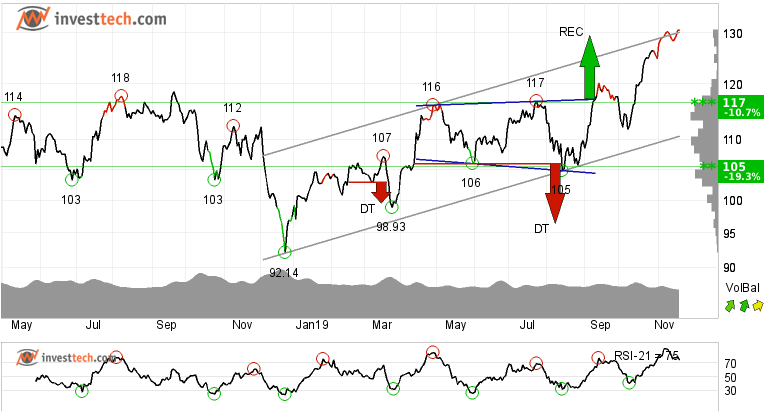
JP Morgan Chase has marginally broken up through the ceiling of the rising trend channel in the medium term, which signals an even stronger rising rate. A lot of research has been done by Investtech in the area regarding position of price with respect to the trend channel, support and resistance and the average return for stocks with respect to the broader index. More about the research can be studied here.
In September, the stock gave a price breakout from a rectangle formation in the medium and long term charts. Even though the target of 130 dollars from the price formation has been met, it still indicates a positive price development for the stock. The stock is around its all time high, hence there is no significant resistance. On the other hand, support is around 125 and 120 dollars in the short term.
Talking about the momentum, it is strong and positive. The volume balance indicator suggests that more and more investors are coming in when the stock price goes up and fewer people are selling when the price is correcting downwards. This is a sign of strength and strengthens the underlying trend. The stock is overall assessed as technically positive in the medium term.
Investtech's outlook (one to six months): Positive
The analyses are based on closing price as per November 19, 2019.
These instruments are traded in currency based on the Exchange or country they are listed on.
Geschreven door

Analist
in Investtech
"Investtech analyseert de psychologie in de markt en geeft u iedere dag concrete trading-voorstellen."

Partner & Senior Advisor - Investtech


Investeringsaanbevelingen worden gedaan door Investtech.com AS ("Investtech"). Investtech garandeert geen volledigheid of juistheid van de analyses. Eventuele fouten in de aanbevelingen, koop- en verkoopsignalen en mogelijke negatieve gevolgen hiervan zijn geheel het risico van de belegger. Investtech neemt geen enkele verantwoordelijkheid voor verlies, direct of indirect, als gevolg van het gebruik van Investtechs analyses. Meer informatie omtrent Investtechs analyses kunt u vinden op disclaimer.
Investeringsaanbevelingen worden gedaan door Investtech.com AS ("Investtech"). Investtech garandeert geen volledigheid of juistheid van de analyses. Eventuele fouten in de aanbevelingen, koop- en verkoopsignalen en mogelijke negatieve gevolgen hiervan zijn geheel het risico van de belegger. Investtech neemt geen enkele verantwoordelijkheid voor verlies, direct of indirect, als gevolg van het gebruik van Investtechs analyses. Meer informatie omtrent Investtechs analyses kunt u vinden op disclaimer.
Hoofdkantoor
Strandveien 171366 Lysaker, Norway
Research-afdeling
Instituttveien 102007 Kjeller, Norway