Buy signals from rectangle formations gave 6.2 per cent in three months
Research results from Investtech, 4 November 2014
Published in English on 9 December 2014. Norwegian original here >>
A research report from Investtech based on 19 years of data from the Oslo Stock Exchange in Norway shows that buy signals from rectangle formations statistically gave a price increase of 6.2 per cent in the three months following the signal. A similar study of rectangle formations on the Stockholm Stock Exchange in Sweden shows that buy signals there gave 5.8 per cent in three months.
Rectangle formations are created in stock prices when buyers and sellers of the stock are balanced over time. Technical analysis theory suggests that investor psychology is about to change when the price breaks out from such formations.

Figure 1: Buy signal from rectangle formation.

Figure 2: Sell signal from rectangle formation.
A break upwards from a rectangle formation triggers a buy signal and a break downwards triggers a sell signal. Investtech’s Head of Research, Mr. Geir Linløkken, has studied the price movements that have followed from buy and sell signals from rectangle formations on the Oslo Stock Exchange over a period of 19 years, from 1996 to 2014.
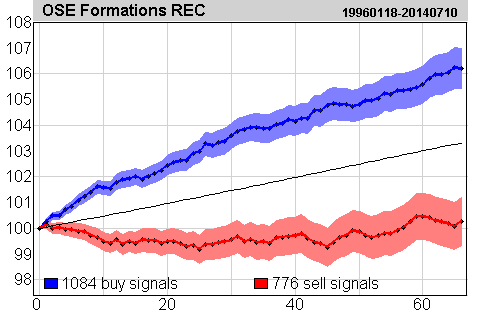
Investtech’s computers identified a total of 1,084 buy signals and 776 sell signals in this period.
Price development following buy and sell signals from rectangle formations on the Oslo Stock Exchange identified by Investtech’s automatic algorithms in medium term charts. Click the image for bigger version.
The chart shows average price development following buy and sell signals from rectangle formations. The signals are triggered on day 0. Only days when the exchange is open are included, so 66 days equal approximately 3 months. Buy signals are the blue line and the sell signals are the red one. The shaded areas show the standard deviation for these calculations. The black line is the benchmark index.
On average, stocks with buy signals increased by 6.2 % after 3 months, whereas stocks with sell signals fell by 0.3 %. Compared to the average stock exchange development in the same period, the buy signals did 2.9 percentage points better and the sell signals did 3.0 percentage points worse.
Click here to read the complete research report for the Oslo Stock Exchange.
The same study was carried out on data from the Stockholm Stock Exchange in Sweden. The research report shows that stocks with buy signals on average increased by 5.8 % after three months. Stocks with sell signals increased by 3.0 %. Compared to the average stock exchange development in the period, stocks with buy signals did 2.0 percentage points better, and stocks with sell signals did 0.8 percentage points worse.
Click here to read the complete research report for the Stockholm Stock Exchange.
Keywords: Buy signal,Oslo Stock Exchange,Rectangle pattern,Sell signal,statistics,Stockholm Stock Exchange.
Geschreven door

Hoofd research en analyse
in Investtech
Insight & Skills:
Buy signal from rectangle formation
Sell signal from rectangle formation
Buy signals from rectangle formations - how often are they succesful?
"Investtech analyseert de psychologie in de markt en geeft u iedere dag concrete trading-voorstellen."

Partner & Senior Advisor - Investtech
Investeringsaanbevelingen worden gedaan door Investtech.com AS ("Investtech"). Investtech garandeert geen volledigheid of juistheid van de analyses. Eventuele fouten in de aanbevelingen, koop- en verkoopsignalen en mogelijke negatieve gevolgen hiervan zijn geheel het risico van de belegger. Investtech neemt geen enkele verantwoordelijkheid voor verlies, direct of indirect, als gevolg van het gebruik van Investtechs analyses. Meer informatie omtrent Investtechs analyses kunt u vinden op disclaimer.
Investeringsaanbevelingen worden gedaan door Investtech.com AS ("Investtech"). Investtech garandeert geen volledigheid of juistheid van de analyses. Eventuele fouten in de aanbevelingen, koop- en verkoopsignalen en mogelijke negatieve gevolgen hiervan zijn geheel het risico van de belegger. Investtech neemt geen enkele verantwoordelijkheid voor verlies, direct of indirect, als gevolg van het gebruik van Investtechs analyses. Meer informatie omtrent Investtechs analyses kunt u vinden op disclaimer.


 Oslo Børs
 Stockholmsbörsen
 Københavns Fondsbørs
 Helsingin pörssi
 World Indices
 US Stocks
 Toronto Stock Exchange
 London Stock Exchange
 Euronext Amsterdam
 Euronext Brussel
 DAX
DAX CAC 40
 Mumbai S.E.
 Commodities
 Currency
 Cryptocurrency
 Exchange Traded Funds
 Investtech Indices


