Research report - buy signals from rectangle formations
By Geir Linløkken (16th August 2005)
About the Author:
Geir Linløkken has an MSc. in Computer Science, specializing in Mathematical Modeling, at the University of Oslo 1995. He founded the analysis company Investtech.com in 1997, where he now works as Head of Research. Mr Linløkken has worked with behavioral finance and automatic systems for visual technical analysis, including the identification of geometrical price patterns, since 1993.
Keywords:
Finance, technical analysis, price prediction, patterns, formations, rectangle, success rate.
Abstract:
Geometric stock price patterns, such as rectangles, are used in technical analysis to predict future stock price development. Very many investors use this as an important basis factor for their stock purchasing decisions. But how good are such predictions really? This report discusses the question based on a study of 629 signals from rectangle formations on the Oslo Stock Exchange during the period 1996 to 2004. On average, the predicted increase in stock price is successful in 67% of the cases.
Rectangle Formations
In technical stock analysis one studies the investors' behaviour within the market, with the aid of charts. The aim being to predict future stock price development, in order to reduce the risk and increase the expected return for an investment. An important part of technical analysis is identifying special geometrical stock price patterns. The idea being that these describe the psychological state of the market, and therefore indicate the further direction of the stock price.
Rectangle formations are one type of such formations.
The stock price moves up and down between a lower support line and an upper resistance line. The support line and resistance line should be almost horizontal and almost parallell, see figure 1. If the stock price breaks upwards through the resistance line, a buy signal is given and technical analysis theory says that the stock price will continue to rise, at least as much as the rectangle is high.
This can be pschologicaly explained by the fact that when a rectangle formation develops, a resistance area is created, with an excess of sellers near the roof of the rectangle. Here the investors have seen that the stock has been expensive, since it has previously turned and reacted downwards from this point, or they consider it expensive based on ecconomic key numbers. When the stock price again increases towards this level, many will wish to sell, which is what causes the resistance. When the stock price then increases through the resistance, it means that these sellers have sold their shares. The buyer side is still just as large, but there is now a lack of sellers, causing the stock price to increase further. Often the stock price will increase relatively quickly following the break and then fall again slightly, before continuing further upwards.
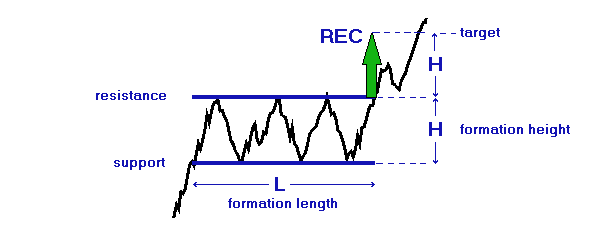
Figure 1.
A rectangle formation with a buy signal. The stock price has for some time moved between two almost parallel and horisontal lines. The lower line is called the support line and the upper line is the resistance line. When either the support or resistance lines are broken, then the theory of technical analysis says that the stock price will continue in the same direction for at least as long as the rectangle is high, which is illustrated here by the green arrow. This level is denoted as the formation's target and should preferably be reaced within a time period which is the same length as the formation.
Research
We wish to investigate how good the theory of technical analysis proves to be in practice. We want to see how often buy signals from rectangle formations are successful. In order for a signal to be considered successful, we require it to acheive its target within a time period which is as long as the formation.
Many investors identify rectangle formations by examining charts and drawing support and resistance lines by hand. This method has many weaknesses, mainly that it is subjective, since one readily identifies the formations one wishes to see, also it is extremely time consuming.
We need, therefore, an automatic algorithm, whereby a computer identifies the formations and the signals they trigger.
Investtech has worked on the automatic identification of geometric stock price formations since the company was founded in 1997. The work is based upon research conducted at the University of Oslo since 1993. The company has developed algorithms and computer programs which are used in their subscription services for share price analysis of the world's stock markets.
The statistics in this report are based upon rectangle formations which are automatically identified by Investtechs computer programs. Figures 2, 3 and 4 show examples of such formations. There has been no optimizing of variables or change of algorithms during the work. We simply undertake a count based on the existing historical material.
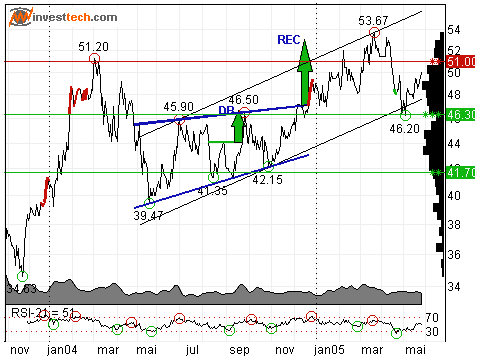
Figure 2. A rectangle formation with a buy signal for EDB Business Partner in autumn 2004. A buy signal was given at 47, on the day the stock price broke above the resistance line in the formation. The signal's target is set to the same as the resistance line plus the formation's height in percent, to the equivalent of 53. This was achieved in march 2005, where the stock price reached a top at 53.67.
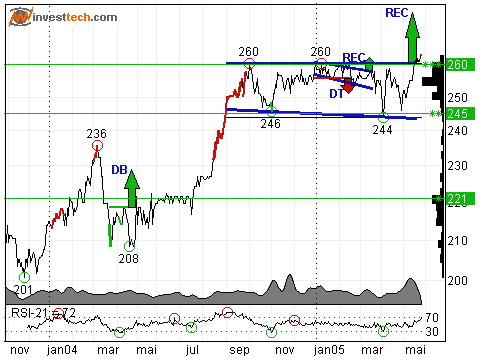
Figure 3.
A rectangle formation with a buy signal for Sparbanken Møre in May 2005. The buy signal was triggered when the stock price broke upwards through the resistance at 260. The stock price should, according to technical analysis, increase to 277 or more during an 8-month period. The figure also shows many smaller formations, respectively a DB - double bottom and a DT - double top, but we shall not discuss these further here.
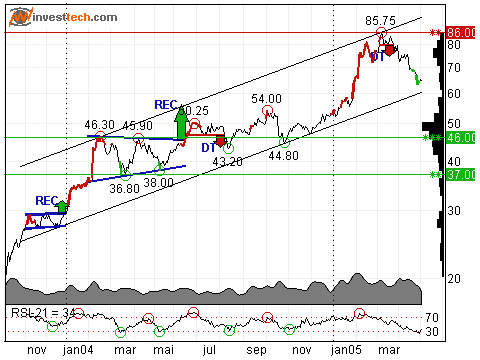
Figure 4.
The technical chart for Tandberg Television. To the right of the chart we can see a small rectangle formation which met its target very quickly. In the middle of the chart, in June 2004, a buy signal is triggered from a rectangle formation which lasted for almost 5 months. This did not achieve its target during the next 5 months, but it was achieved during a period of 8 months.
Basis Data
We have used share prices from 01.01.1996 until 30.05.2005 as a basis for the statistics. During this period the main index for the Oslo Stock Exchange rose by 160%, the equivalent of 10.7% per year. In relation to the risk free intrest for the period, this is considered to be about what one would expect for similar time periods.
For five of the years the exchange rose by over 30%, whilst it fell during three of the years by more than 15%. In other words there have been both rising and falling periods, and similarly a number of relatively sideways periods, so the given time period is considered to be representative of a normal time period.
All stocks which have been listed on the exchange for the period are used. Stocks which have been delisted due to e.g. fusion, being bought up or bankruptcy, are included. For these companies we have, however, only data for as long as they were listed. A company which has gone bankrupt will thereby have a closing price not equal to 0, which is a weakness of the research. Mostly such companies also fall dramatically prior to delisting, such that the difference between the stock price fall while they were listed and the price fall down to 0 will be only slight.
When a company falls, moreover, it is extremely seldom that new buy signals from rectangle formations are generated, since these are what this study is focused on, so this should mean very little for the results of the research.
Alle stock prices are adjusted for splits, dividends, subscription rights and other capital changes, ensuring that they mirror the actual value development of the shares.
The Data Set
We have used Investtech.com's algorithms for automatic identification of rectangle formations. The algorithms were run on medium-long Investtech charts, consisting of about 18 months stock price history, as in figures 2, 3 and 4. We consider the algorithms to be good at identifying actual rectangles, without at the same time classifying false rectangles as actual rectangles.
In order to identify buy signals on day t, the stock price data up to and including day t is used. Future data, for days t+1, t+2 etc., is kept hidden from the algorithm.
As a starting point, all identified buy signals from rectangle formations are used. Each formation will usually only give one signal. However, occasionally, more signals can be triggered. This occurs if the stock price reacts back into the formation following a break, creates a modified formation, then later breaks again.
In some instances, more than one signal can be triggered by the same share on the same day. This happens if the algorithm recognises more formations, of varying length and height, which break simultaniously.
In order for a data set to be seen as being representative for investors, we remove some signals from the set.
- Duplicate signals are removed. This is in the event of company mergers and ticker changes, where Investtech has two examples of the same historical time series. For example we remove a buy signal for DnBNOR, since we already have it registered for DnB.
- Formations which were below 2% high were disregarded. These would have very little practical trading value because the fees are too high in relation to the forseen returns.
- Signals for shares with poor liquidity are disregarded. This is done firstly because it is difficult for investors to make actual trades for such stocks, but also because the stock price chart is often extremely variable, containing large leaps, so that the pricing is doubtful and infested with a lot of noise.We disregard signals where the stock had turnover less than 50% of the days, or for lower than an average of 0.1 million kroner per day during the last 22 days prior to the signal being identified. By doing this, signals from the indexes were also removed, meaning that we are left with only signals from shares.
- Signals with short following price history cannot be used. For a formation with the length of L days, we need L days of history following the buy signal in order to see if the signal is successful or not. Signals with a following price history which is below that are disregarded.
For signals in 2005, the following price history is generally too short, so we disregard all these signals.
Our data set now consists of 629 identified buy signals from rectangle formations in shares on the Oslo Stock exchange during the period 1996 to 2004.
These had an average length of 96 trading days and an average height of 15%.
Click here to see the entire data set.
Results
A count of the 629 buy signals shows that there were 421 of them, the equivalent of 67 percent, which met their targets within a time period which was of the same length as the rectangle.
We will see below how the general stock exchange development affects the probability of the buy signals being successful, what the rectangles' percentage height means and how rapidly the signals meet their targets.
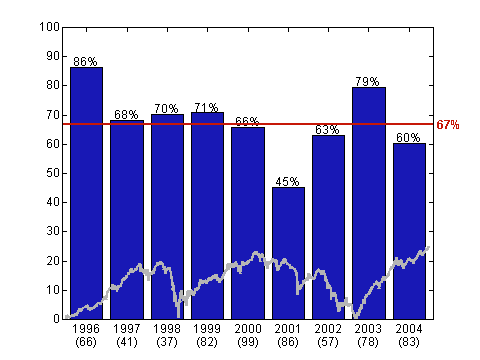
Figure 5.
The percentage share of buy signals from rectangle formations which are successful. The columns show the share of buy signals in rectangle formations, where the stock price subsequently increases to an amount equal to the rectangle's resistance line, plus the rectangle's height, in percent, for a time period equal to the rectangle's length.
The number in brackets under the column denotes the number of signals which were identified for that year. The red line denotes the average of all the identified buy signals. The Reference Index for the Oslo Stock Exchange is shown in grey.
The results in figure 5 are spread over time and shown in relationship to the exchanges general development, measured by the Reference Index. There appears to be a certain relationship between how the exchange does and the amount of buy signals which are successful. For example, we can see that rectangles identified in 1996 and 2003, when the exchange rose by 32 and 48 percent, produced especially good results.
In 1998, 2001 and 2002, the exchange fell with respectively 27%, 15% and 31%. Here we would expect that stocks with buy signals should give poorer results than in good years. We see that this proves to be correct for 2001 and 2002, whilst in 1998 there were a larger number than average which were successful.
In 1998 there were only 37 signals, so in this case few samples and statistical chance can explain some of the deviation. An inspection of the data shows, however, that many of the signals were from the property and consumer sectors. These are sectors with little significance on the Reference Index, so if these sectors did well, then we would be only slightly able to see this in the main index's development, but even so the hit rate would be good within these sectors.
One conclusion we can draw from this is that buy signals from rectangle formations can still be successful, even if the general exchange development is negative.
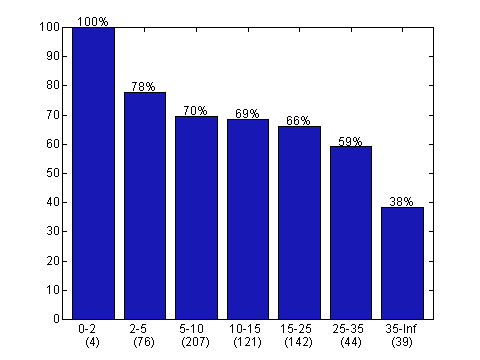
Figure 6. The percentage share of buy signals from succsessful rectangle formations, as a function of the formation's height in percent. For the sake of completeness, the formations which have less than 2% height are also included in the figure, even though these aren't included in the data set which is otherwise used in the report.
When one is buying shares based on signals from rectangle formations, it is interesting to know more about which formations are most successful. In figure 6 the formations are ordered by height, given in percent, respectively 0-2%, 2-5%, 5-10% etc., and the probability that the signals are successful is calculated for each group. The first column is for the smallest formations, those which are 0-2% high. We can see here that 100% were successful. There were, however, only 4 formations in this group, giving a somewhat thin statistical basis, so this result is not considered to be very significant.
Column number 2 shows a success rate of 78% for the relatively small formations of 2-5% high. This is well over the average.
The next three columns, for formations of 5-25% high, show results at about the average.This is natural, since no less than 75% of our observations lie within this interval.
The two final columns are for high and very high formations. About 10% of our signals are within these categories. Formations of 25-35% show less prediction power than the average, but there are still well over 50% of these which are successful. Among the highest formations are there 38% which are successful, which is far below the average.
Generally, we see that the probability that a signal is successful decreases when the formation's height increases. It is more likely that a buy signal from a small formation is successful, than that a signal from a large formation is successful.
On the other hand, the benefits in percent are much higher for the large formations than for the smaller, so an investment can still be viable, even with a low success percentage.
In order to research this further, one needs to create concrete trading strategies and simulate these. We shall not do this here, but this is a current area for further research.
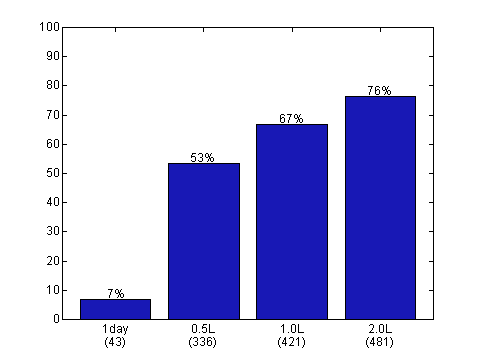
Figure 7. The percentage share of buy signals from rectangle formations, which meet their targets within periods of respectively one day, half a formation length, one formation length and two formation lengths, after the signal.
Figure 7 shows how quickly shares with buy signals from rectangle formations meet their targets. We can see that 7% of the formations met their targets within one day after the buy signal. There were 53% within half a formation length, whilst there were 67% after one formation length and 76% after two formation lengths.
During the day a rectangle formation gives buy signals and on the following day, there is only a share of 7% which reach the target. It is positive that there are so few, since this indicates that investors can expect a reasonable profit, even if they aren't too quick to buy.
After half of the formations length, however, we see that over 50% of the signals have already been successful, which indicates that neither should one wait too long before buying such a stock.
During a period which is as long as the formation, there are 67% of the signals which are successful. This has been examined earlier in this report.
It is, however, interesting to see that the success percent increases significantly, to 76%, if one holds on to the shares for twice as long.
The question of the increase being so substantial that one should hold on to the shares so long, lies outside of the bounries for this report's conclusions.
Conclusion
Based on rectangle formations automatically identified by Investtech's algorithms on the Oslo Stock Exchange for the period 1996-2004, we have seen that 67% of the signals from rectangle formations on the 18-month charts have been successful. The time period for this research is quite substantial, so the quality of the basis data is seen as being very good and the fully automated algorithms which are used are considered to identify only actual rectangles. Given the assumption that the investor's collective psychological behaviour in the stock market is constant over time, we believe that buy signals from rectangle formations will produce similar results in the future, also for other stock exchanges.
We have seen that the exchange's general development is of consequence for the proportion of signals which are successful, but that there are also a relatively high number which are successful during negative exchange years. The small formations are successful to a greater degree than the large ones. Although it can however be more beneficial to invest based on the large formation, an area which has been identified as current for further work.
Many of the signals from rectangle formations meet their targets already after a time period of half of the formation's length, whilst there are over 3 out of 4 which meet their targets after twice the length of the formation. It is therefore not openly obvious how long one should sit on a stock following a buy signal from a rectangle formation, also an area which is current for further work.
Litterature
- Geir Linløkken and Steffen Frølich. Technical Stock Analysis - for reduced risks and increased returns. Investtech.com, 2001.
- John J. Murphy. Technical Analysis of the Financial Markets. New York Institute of Finance, 1999.
- Guido J. Doboeck. Trading on the edge. John Wiley and Sons, 1994.
- R.O. Duda og P.E. Hart. Pattern Classification and Scene Analysis. John Wiley and Sons, 1973.
- M. Ridley. The mathematics of markets. The Economist, October 9th 1993.
Investeringsaanbevelingen worden gedaan door Investtech.com AS ("Investtech"). Investtech garandeert geen volledigheid of juistheid van de analyses. Eventuele fouten in de aanbevelingen, koop- en verkoopsignalen en mogelijke negatieve gevolgen hiervan zijn geheel het risico van de belegger. Investtech neemt geen enkele verantwoordelijkheid voor verlies, direct of indirect, als gevolg van het gebruik van Investtechs analyses. Meer informatie omtrent Investtechs analyses kunt u vinden op disclaimer.
Investeringsaanbevelingen worden gedaan door Investtech.com AS ("Investtech"). Investtech garandeert geen volledigheid of juistheid van de analyses. Eventuele fouten in de aanbevelingen, koop- en verkoopsignalen en mogelijke negatieve gevolgen hiervan zijn geheel het risico van de belegger. Investtech neemt geen enkele verantwoordelijkheid voor verlies, direct of indirect, als gevolg van het gebruik van Investtechs analyses. Meer informatie omtrent Investtechs analyses kunt u vinden op disclaimer.


 Oslo Børs
 Stockholmsbörsen
 Københavns Fondsbørs
 Helsingin pörssi
 World Indices
 US Stocks
 Toronto Stock Exchange
 London Stock Exchange
 Euronext Amsterdam
 Euronext Brussel
 DAX
DAX CAC 40
 Mumbai S.E.
 Commodities
 Currency
 Cryptocurrency
 Exchange Traded Funds
 Investtech Indices