
 Oslo Børs
 Stockholmsbörsen
 Københavns Fondsbørs
Investeringsforeninger
Københavns Fondsbørs
Investeringsforeninger
 Helsingin pörssi
 World Indices
 US Stocks
US 30
Nasdaq 100
US 500
US Stocks
US 30
Nasdaq 100
US 500
 Toronto Stock Exchange
 London Stock Exchange
 Euronext Amsterdam
 Euronext Brussel
 DAX
SDAX
TECDAX
Frankfurt
CDAX
MDAX
Prime Standard
DAX
SDAX
TECDAX
Frankfurt
CDAX
MDAX
Prime Standard
 CAC 40
 Mumbai S.E.
National S.E.
Mumbai S.E.
National S.E.
 Commodities
 Currency
 Cryptocurrency
 Exchange Traded Funds
 Investtech Indices
Momentum and RSI
RSI is an often used indicator in technical analysis. RSI means Relative Strength Index, and it measures how well a stock has performed compared to itself. The figure is calculated by looking at the strength of days with rising prices compared to strength of days with falling prices over a certain period of time and it gets a value between 0 and 100.
A stock that has risen a lot compared to reactions back during this time, will have high RSI. Similarly a stock that has fallen a lot compared to reactions back, will have low RSI. RSI is used as an indicator of whether a stock is oversold or overbought, and if it has positive momentum or negative momentum.
RSI can indicate that:
- This stock has risen a lot in a short time. Optimism is increasing and further rise is indicated.
- This stock has fallen a lot in a short time. The investors are becoming more pessimistic and will continue to reduce prices to get out of the stock.
Many investors also think that RSI indicates whether a stock has risen or fallen too much and will react back. Investtechs research shows that this overbought and oversold interpretation is statistically not true.
Read the research report on RSI here.
RSI as overbought/oversold indicator
A stock is overbought when it has risen a lot in a short time, without any significant reactions back during the time period. The idea is that it has risen too much and will have a reaction back soon, indicating that it is time to sell the stock. Similarly a stock is oversold when it has fallen a lot in a short time. This may indicate that it will have a reaction up soon and should be bought before then. See example below.
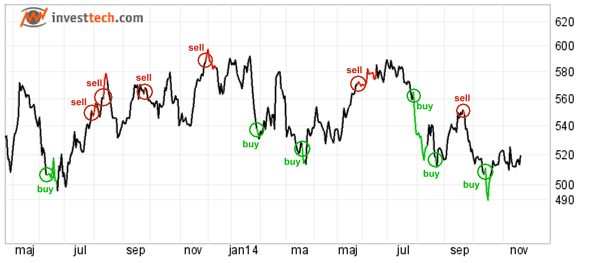
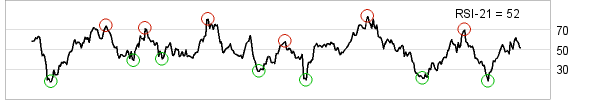
Figure 1: RSI21 in Carlsberg B. Green areas show oversold RSI (below 30) and red areas overbought RSI (above 70).
RSI as momentum indicator
RSI is also used as a momentum indicator. The idea is that major price movements indicate that the investors as a group are in motion. It is thought necessary to join the early movements, as even more investors will join later and drive the price further in the same direction. See example below.
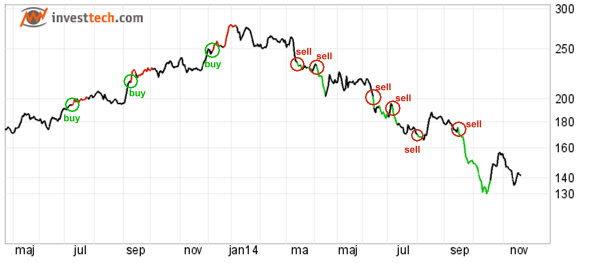
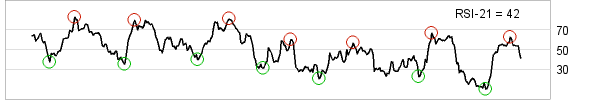
Figure 2: RSI21 in D/S Norden. Red areas show high momentum and positive (RSI above 70) and green areas show high momentum and negative (RSI below 30).
High positive momentum and overbought
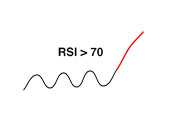 RSI above 70 shows strong positive momentum in the stock. The stock has risen in the short term, with few reactions downwards. Investors have continued to pay more to buy stocks. This indicates that more buyers are entering the stock and that the price will continue to rise.
RSI above 70 used to be considered a sign of danger. These stocks were said to be overbought and it was assumed they would soon see a reaction down. However, Investtechs research shows that these stocks have continued to rise, in fact more so than the market.
The following applies to high RSI:
- Indicates short term strength
- Indicates that investors are positive and that the price will continue to rise
- Many investors think this is a negative signal, but our research shows it is clearly positive
In general we want high RSI, i.e. strong short term momentum, for stocks we own or are going to buy. It can be a psychological challenge to buy such stocks, since they have already risen quite a bit and may seem expensive. However, high RSI indicates that more investors are buying and that the rise will continue.
Investtech-Research: High positive momentum and overbought
Aktien mit solchen kaufsignale haben sich in den Monaten danach im Durchschnitt besser als der Markt entwickelt. Die annualisierte Mehrrendite war 7.4 Prozentpunkte (%p). Das ist signfikant besser als der Referenzindex.
| Annualisierte Rendite (basierend auf 66 Tagen) | |
| Kaufsignale mittlere sicht | 17.1% |
| Referenzindex | 9.7% |
| Mehrrendite | 7.4%p |
Diese Analyseergebnisse basieren auf 35864 Signalen für nordische Aktien im Zeitraum 2008-2020.
Mehr dazu hier
- Researchbericht: RSI - Relative Strength Index signal statistics for the Nordic markets, 1996 to 2018 (Erforderliche Benutzerebene: PRO)
- Researchartikel: RSI is a good momentum indicator
- Researchbericht: Investtech-forskning: RSI - Relative Strength Index - signalstatistikk nordiske markeder 2019 og 2020 (Erforderliche Benutzerebene: PRO)
- Researchartikel: Investtech-forskning: Høy RSI var et godt kjøpssignal under koronapandemien
- Researchbericht: Investtech-forskning: RSI - Relative Strength Index - signalstatistikk nordiske markeder 2008-2020 (Erforderliche Benutzerebene: PRO)
High negative momentum and oversold
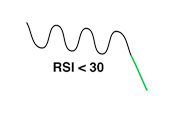 RSI below 30 shows strong negative momentum in the stock. The stock has fallen a lot in a short time, without significant reactions upwards. Investors keep reducing the price to sell their stocks. This indicates that investors are leaving the stock, pessimism is increasing and the price will continue to fall.
RSI below 30 used to be considered a good buy opportunity. These stocks were oversold, having fallen a lot in a short time. The theory said they would soon see a reaction upwards. However, Investtechs research shows that these stocks have clearly underperformed compared to the market.
The following applies to low RSI:
- Indicates short term weakness
- Indicates negative investors and that prices will continue to fall
- Many investors think it is a positive signal, but our research shows it is clearly negative
Stocks with low RSI have negative momentum and our research shows you should stay away from such stocks. It may be tempting to buy such stocks, because they have fallen a lot and seem cheap. However, low RSI indicates increasing pessimism and that the price will continue to fall.
Investtech-Research: High negative momentum and oversold
Aktien mit solchen verkaufssignale haben sich in den Monaten danach im Durchschnitt schwächer als der Markt entwickelt. Die annualisierte Minderrendite war 5.7 Prozentpunkte (%p). Das ist signifikant schwächer als der Referenzindex.
| Annualisierte Rendite (basierend auf 66 Tagen) | |
| Verkaufssignale mittlere sicht | 6.1% |
| Referenzindex | 11.7% |
| Mehrrendite | -5.7%p |
Diese Analyseergebnisse basieren auf 24920 Signalen für nordische Aktien im Zeitraum 2008-2020.
Mehr dazu hier
- Researchbericht: RSI - Relative Strength Index signal statistics for the Nordic markets, 1996 to 2018 (Erforderliche Benutzerebene: PRO)
- Researchartikel: RSI is a good momentum indicator
- Researchbericht: Investtech-forskning: RSI - Relative Strength Index - signalstatistikk nordiske markeder 2019 og 2020 (Erforderliche Benutzerebene: PRO)
- Researchartikel: Investtech-forskning: Høy RSI var et godt kjøpssignal under koronapandemien
- Researchbericht: Investtech-forskning: RSI - Relative Strength Index - signalstatistikk nordiske markeder 2008-2020 (Erforderliche Benutzerebene: PRO)
Die Anlageempfehlungen werden von Investtech.com AS ("Investtech") ausgearbeitet. Investtech übernimmt keine Haftung für die Vollständigkeit oder Richtigkeit der jeweiligen Analyse. Ein etwaiges Engagement aufgrund der aus den Analysen resultierenden Empfehlungen/Signale erfolgt zur Gänze für Rechnung und Risiko des Anlegers. Investtech haftet nicht für Verluste, die sich direkt oder indirekt infolge der Nutzung von Investtechs Analysen ergeben. Angaben zu etwaigen Interessenkonflikten gehen stets aus der Anlageempfehlung hervor. Weitere Informationen zu Investtechs Analysen finden Sie unter disclaimer.
Die Anlageempfehlungen werden von Investtech.com AS ("Investtech") ausgearbeitet. Investtech übernimmt keine Haftung für die Vollständigkeit oder Richtigkeit der jeweiligen Analyse. Ein etwaiges Engagement aufgrund der aus den Analysen resultierenden Empfehlungen/Signale erfolgt zur Gänze für Rechnung und Risiko des Anlegers. Investtech haftet nicht für Verluste, die sich direkt oder indirekt infolge der Nutzung von Investtechs Analysen ergeben. Angaben zu etwaigen Interessenkonflikten gehen stets aus der Anlageempfehlung hervor. Weitere Informationen zu Investtechs Analysen finden Sie unter disclaimer.
Copyright Ⓒ 1997-2024 Investtech.com AS, Org nr 978 655 424 MVA Datenschutzerklärung | Haftungsausschluss
Zentrale
Strandveien 171366 Lysaker, Norway
Forschungsabteilung
Instituttveien 102007 Kjeller, Norway