
 Oslo Børs
 Stockholmsbörsen
 Københavns Fondsbørs
Investeringsforeninger
Københavns Fondsbørs
Investeringsforeninger
 Helsingin pörssi
 World Indices
 US Stocks
US 30
Nasdaq 100
US 500
US Stocks
US 30
Nasdaq 100
US 500
 Toronto Stock Exchange
 London Stock Exchange
 Euronext Amsterdam
 Euronext Brussel
 DAX
SDAX
TECDAX
Frankfurt
CDAX
MDAX
Prime Standard
DAX
SDAX
TECDAX
Frankfurt
CDAX
MDAX
Prime Standard
 CAC 40
 Mumbai S.E.
National S.E.
Mumbai S.E.
National S.E.
 Commodities
 Currency
 Cryptocurrency
 Exchange Traded Funds
 Investtech Indices
Research results India - rising and falling trends
Published 25 March 2019
A new research report from Investtech based on 12 years of data from the National Stock Exchange in India shows that stocks with buy signal from rising trend on average have risen by 5.2 % in three months, while stocks with sell signal from falling trend have risen by 0.2 %.
Trends are one of the most important elements of technical analysis. They are visual and intuitive and describe in which direction a stock is moving. A rising trend indicates lasting and increasing optimism among investors, often as a result of a great deal of positive news about the stock.
Identifying a trend requires studying the price movements. Stock prices rarely move in a straight line. Instead they move in a series of tops and bottoms. Drawing a straight line through two or more rising bottoms produces the support line in a rising trend. See figure 1. Continue to draw a line parallel to the support line thought the rising tops. This line is called the trends resistance line. Support and resistance lines combined make up the trend, see figure 2.
Figure 1. Support line in a rising trend.

Figure 2. Rising trend with support line and resistance line.
Similarly, a falling trend is produced when a straight line can be drawn through two or more falling tops and a parallel line through falling bottoms.
Many investors identify trends by studying charts and drawing trend lines by hand. This method has many weaknesses, the most important of which is that it is subjective. You see the trends you want to see and which perhaps fit your own subconscious preferences. It is also a very time consuming method. Investtech has developed automatic algorithms for identification of trends. Every day these algorithms identify the best trend in the chart, on criteria such as distance between the trends support and resistance lines and the number of data points near these lines. Roughly 80,000 various trend alternatives are assessed each day for a medium term Investtech chart with 18 months of historical data. These are given a score and the best trend is selected.
R&D Manager Geir Linløkken has studied which price movements have followed buy and sell signals from rising and falling trends respectively at the National Stock Exchange in India over a period of 12 years, from 2007 to 2018.
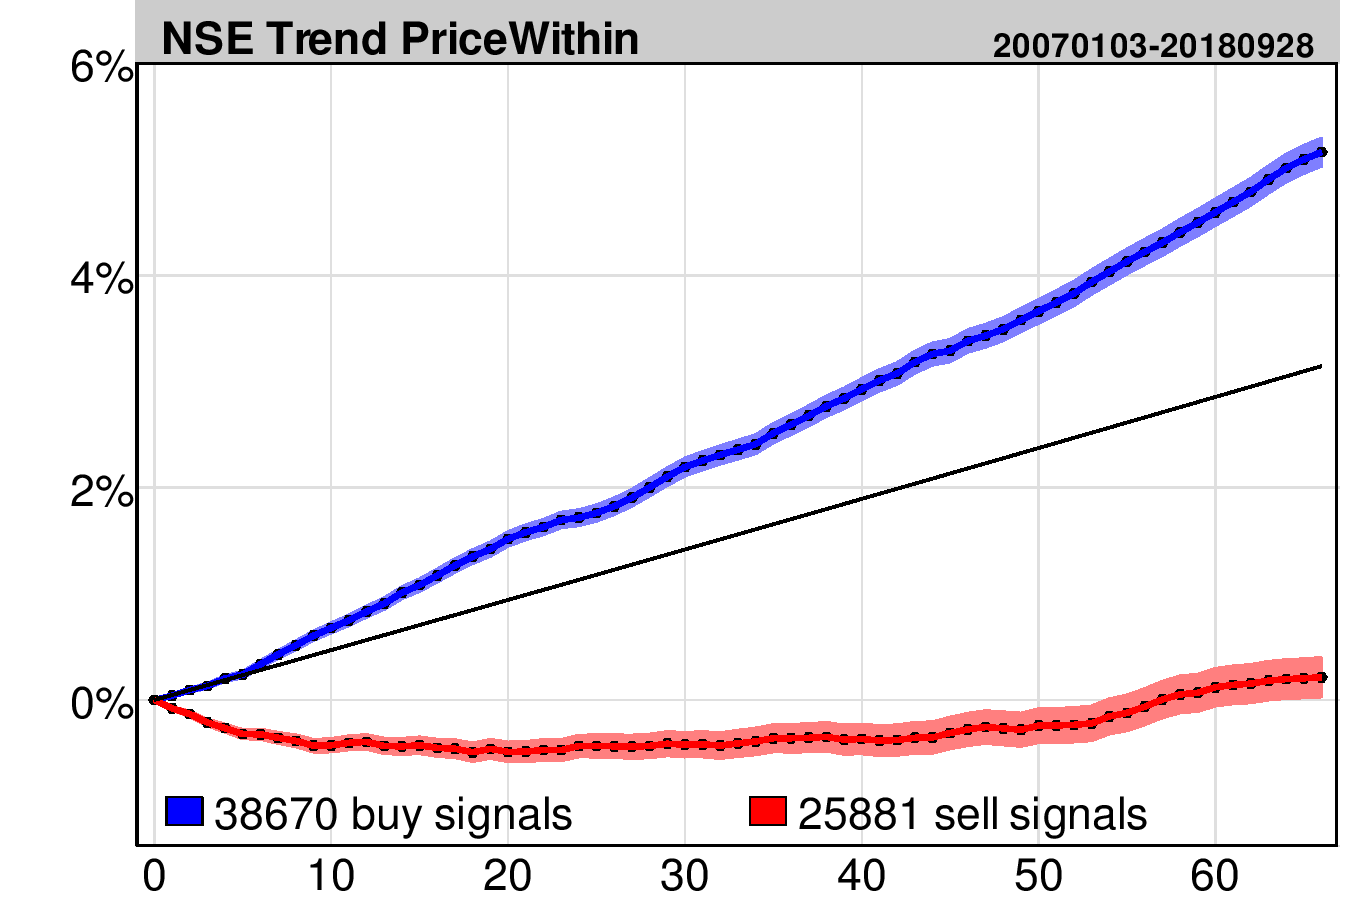
Investtech's computers identified a total of 38,670 buy signals and 25,881 sell signals in the period.
Click for bigger chart.
The chart shows price development following buy and sell signals from rising and falling trends at the National Stock Exchange in India identified by Investtech's automatic algorithms in medium long term charts. Signals are triggered on day 0. Only days when the exchange is open are included, so 66 days equal approximately three months. Buy signals are the blue line and sell signals are the red one. The shaded areas are the standard deviation of the calculations. Benchmark index is the black line.
Stocks with buy signals have on average risen 5.2 % in three months, while stocks with sell signals have risen 0.2 %. Compared to average benchmark in the period, buy signals have given an excess return of 2.0 percentage points and sell signals a negative excess return of 2.9 percentage points. Consequently buy signals have given an annualized excess return of 9.1 percentage points and sell signals an annualized negative excess return of 12.3 percentage points.
Please find more results and details in the research report here.
Keywords: falling trend,National Stock Exchange India,NSE,rising trend,statistics,Trend,trend signals.
Skrevet af

Forsknings- og analysechef
i Investtech
"Investtech analyserer psykologien i markedet og giver dig konkrete tradingforslag hver dag."

Partner & Senior Advisor - Investtech


Investeringsanbefalinge(r)n(e) er udarbejdet af Investtech.com AS ("Investtech"). Investtech garanterer ikke for fuldstændigheden eller rigtigheden af analysen. Eventuel eksponering i forhold til de råd / signaler, som fremkommer i analyserne, står helt og holdent for investors regning og risiko. Investtech er hverken direkte eller indirekte ansvarlig for tab, der opstår som følge af brug af Investtechs analyser. Oplysninger om eventuelle interessekonflikter vil altid fremgå af investeringsanbefalingen. Yderligere information om Investtechs analyser findes på infosiden.
Investeringsanbefalinge(r)n(e) er udarbejdet af Investtech.com AS ("Investtech"). Investtech garanterer ikke for fuldstændigheden eller rigtigheden af analysen. Eventuel eksponering i forhold til de råd / signaler, som fremkommer i analyserne, står helt og holdent for investors regning og risiko. Investtech er hverken direkte eller indirekte ansvarlig for tab, der opstår som følge af brug af Investtechs analyser. Oplysninger om eventuelle interessekonflikter vil altid fremgå af investeringsanbefalingen. Yderligere information om Investtechs analyser findes på infosiden.
Copyright Ⓒ 1997-2024 Investtech.com AS, Org nr 978 655 424 MVA Persondataforordning | Ansvarsfraskrivelse
Hovedkontor
Strandveien 171366 Lysaker, Norway
Forskningsafdeling
Instituttveien 102007 Kjeller, Norway