Three buy and one sell
Published March 21, 2019
Wishes of Holi to all readers!
The market showed a flat development and Nifty 50 (NIFTY) ended the day at 11521 points or 0.10 per cent down from Tuesday's close. The index thereby pressed its breaks after seven days of gains.
Few Nifty 50 stocks including Reliance Industries are making all time highs which are pushing the index higher and closer to its earlier peak. But same is not the case with the Midcap and Smallcap indices. Where Nifty Midcap 100 index is still trying to recover from its lows in February, Nifty Smallcap 100 has given a breakout from the falling trend channel and a double bottom formation at the same time. This clearly suggests that the mid and small cap stocks must have really good interest from the investors to catch up with large cap stocks.
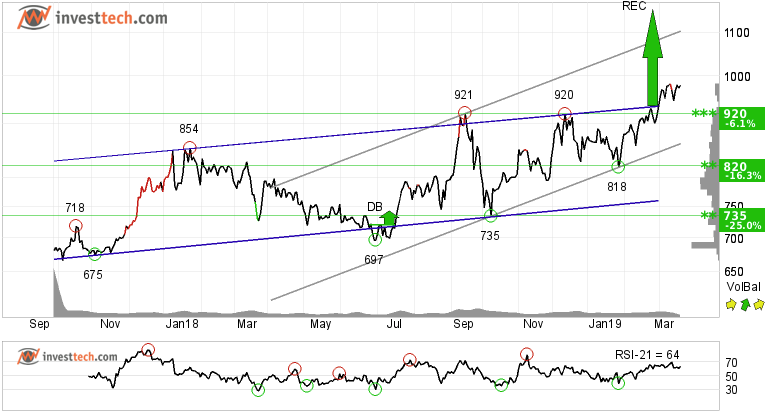
ICICI Lombard General (ICICIGI.NS) Close: 979.85
ICICI Lombard General is inside a rising trend channel in the medium term and has given a positive breakout from the rectangle formation. Further rise to 1157 or more is signalled. The stock has support at rupee 920.
As per Investtech's research, stocks that have given buy signal, break upwards from rectangle formation have given an annualized return of 21.1 per cent and excess return of 8.0 percentage points over benchmark index.
Recommendation one to six months: Positive
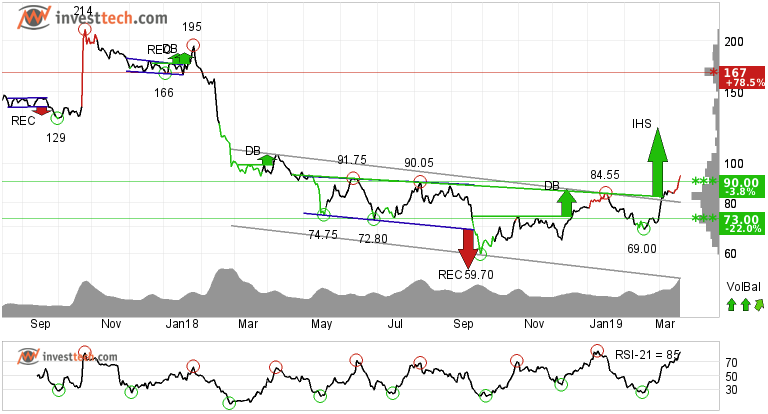
Punjab National Bank (PNB.NS) Close: 93.55
Punjab National Bank fell more than 70 per cent from its peak in October 2017 and has now started to correct upwards. Two weeks back the stock broke out of the falling trend channel and gave a buy signal from an inverted head and shoulders formation. Very recently the stock has also broken above its resistance of 90 rupees. Further rise to 123 or more is signalled. Support is around 90 and 84.50 rupees in the short term.
Volume balance is positive and the momentum indicator RSI is rising and above 70. These indicators together support the rise in price. However, one must be careful as volatility risk is high with 24 per cent on a monthly basis.
Recommendation one to six months: Positive
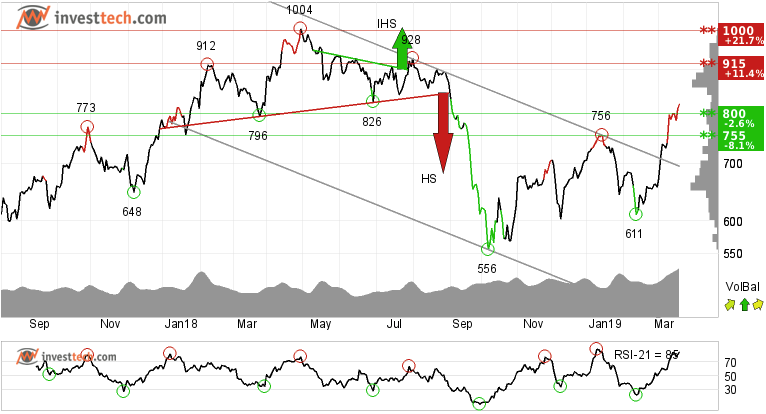
Escorts Limited (ESCORTS.NS) Close: 821.55
Escorts Limited has broken out of the falling trend channel and multiple resistance levels in the medium term. The stock had given a sell signal from a head and shoulders formation last year and fell sharply. But over the course of the last six months the stock made higher tops and higher bottoms to rise above the resistance of 800 rupees. Further rise in price is expected.
RSI is above 70 after a good price increase the past weeks. The stock has strong positive momentum and further increase is indicated. The volume balance indicator is also positive, as more buyers have bought the stock at rising prices and number of sellers has decreased when the stock reacted downwards. The stock is overall assessed as technically slightly positive for the short to medium term.
Recommendation one to six months: Positive
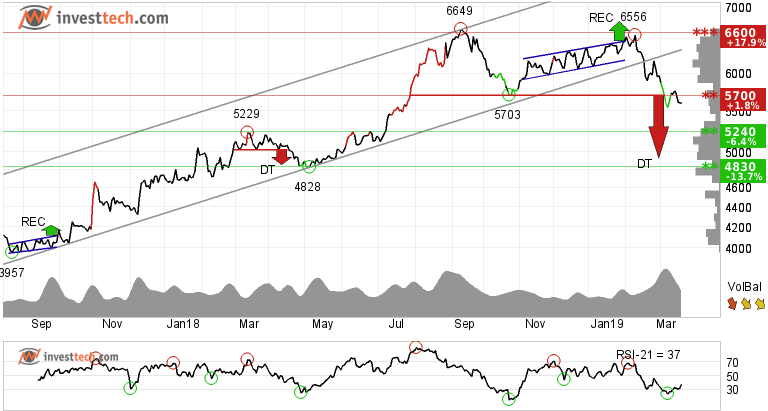
Sanofi India Limited (SANOFI.NS) Close: 5599.50
Sanofi India Limited has broken down from the rising trend channel in the medium term. In the first place that signals a slower rate of rise or a development in to more of a sideways trend. However, in this case the stock has given a sell signal from a double top formation, which is a top reversal pattern. Further downside to price target of 4600 rupees or less is signalled.
There is support around 5240 and 4830 rupees, but in case of a reversal there is resistance between 5700 and 6070. Short term volume balance is negative and the momentum indicator RSI-curve is falling and under 30. This suggests that investors are selling when the price falls and less buy interest during reversals.
In the long term chart, a similar price formation has appeared and the support is around 5000 and next at 4700 rupees. The stock is overall assessed as technically negative for the short term.
Recommendation one to six months: Negative
The analyses are based on closing price as per March 20, 2019. Maintaining proper stop loss is always recommended.
Skrevet af

Analytiker
i Investtech
Archive:
12 March: Cement stocks are posing good opportunity
08 March: Clear breakout and reversal from intermediate downtrend
07 March: Deepak Nitrite Limited looks promising to enter into a trade
06 March: Three buy candidates for medium to long term
28 February: Breakout in these three stocks invites for early opportunity
26 February: Two buy opportunities for the near term future
21 February: Stocks with RSI above 70, based on our research
19 February: Close to selling point, time to be cautious
15 February: These two sugar stocks look promising
14 February: Three short to medium term opportunities
08 February: One buy and one sell in stocks while index suggests caution
06 February: One buy and one sell, short to medium term opportunities
01 February: Upside breakout from price formations
30 January: Buying opportunity: Reversing from trend channel support
9 January: One positive and one to stay away from
2 January: A good investment opportunity
2018
21 December: Good buying opportunities
14 December: Positive on these three stocks
11 December: One buy and one sell signal
07 December: Sell Signals in Three Big Stocks
04 December: Highest scorer of our Top 50 list
30 November: Positive stocks with 5-11 per cent upside potential
28 November: Buy signal on high volume
27 November: One Buy and One Sell Signal
23 November: Fear dominates these stocks
21 November: Sell signal, time to stay away
20 November: Early opportunity from short term buy signal?
16 November: Two Buy Signals and One Sell Signal
15 November: Buy signal in this one
13 November: Big auto stocks comparison
09 November: What to wait for?
06 November: Banking stocks look positive
02 November: Positive on this one
01 November: TECHM, NIFTY50 and Hausse
31 October: What are investors thinking?
30 October: Bullish on these three stocks
26 October: Three potential candidates to ride on
24 October: Three big Metal stocks, Seasonal variation
22 October: Among top performers on our Top 50 list
18 October: Three stocks investors should stay away from
17 October: Flowing against the tide
16 October: Positive on these 2 stocks
11 October: Over 45 per cent rise
9 October: The Indian banking space
5 October: Nifty closes at a crucial level
2 October: Price formations in the long-term charts
28 September: Positive on Biocon Limited
"Investtech analyserer psykologien i markedet og giver dig konkrete tradingforslag hver dag."

Partner & Senior Advisor - Investtech
Investeringsanbefalinge(r)n(e) er udarbejdet af Investtech.com AS ("Investtech"). Investtech garanterer ikke for fuldstændigheden eller rigtigheden af analysen. Eventuel eksponering i forhold til de råd / signaler, som fremkommer i analyserne, står helt og holdent for investors regning og risiko. Investtech er hverken direkte eller indirekte ansvarlig for tab, der opstår som følge af brug af Investtechs analyser. Oplysninger om eventuelle interessekonflikter vil altid fremgå af investeringsanbefalingen. Yderligere information om Investtechs analyser findes på infosiden.
Investeringsanbefalinge(r)n(e) er udarbejdet af Investtech.com AS ("Investtech"). Investtech garanterer ikke for fuldstændigheden eller rigtigheden af analysen. Eventuel eksponering i forhold til de råd / signaler, som fremkommer i analyserne, står helt og holdent for investors regning og risiko. Investtech er hverken direkte eller indirekte ansvarlig for tab, der opstår som følge af brug af Investtechs analyser. Oplysninger om eventuelle interessekonflikter vil altid fremgå af investeringsanbefalingen. Yderligere information om Investtechs analyser findes på infosiden.


 Oslo Børs
 Stockholmsbörsen
 Københavns Fondsbørs
 Helsingin pörssi
 World Indices
 US Stocks
 Toronto Stock Exchange
 London Stock Exchange
 Euronext Amsterdam
 Euronext Brussel
 DAX
DAX CAC 40
 Mumbai S.E.
 Commodities
 Currency
 Cryptocurrency
 Exchange Traded Funds
 Investtech Indices