
 Oslo Børs
 Stockholmsbörsen
 Københavns Fondsbørs
Investeringsforeninger
Københavns Fondsbørs
Investeringsforeninger
 Helsingin pörssi
 World Indices
 US Stocks
US 30
Nasdaq 100
US 500
US Stocks
US 30
Nasdaq 100
US 500
 Toronto Stock Exchange
 London Stock Exchange
 Euronext Amsterdam
 Euronext Brussel
 DAX
SDAX
TECDAX
Frankfurt
CDAX
MDAX
Prime Standard
DAX
SDAX
TECDAX
Frankfurt
CDAX
MDAX
Prime Standard
 CAC 40
 Mumbai S.E.
National S.E.
Mumbai S.E.
National S.E.
 Commodities
 Currency
 Cryptocurrency
 Exchange Traded Funds
 Investtech Indices
Global stocks: 2 buy and 1 sell, LSE listed stocks this week
Published November 8, 2018
Webinar November 14
Join our free online webinar on November 14 . Analyst Kiran Shroff and Country Manager Jan Marius van Leeuwen will give an introduction to Investtech's analyses and present stock picking tools & strategies.
This week we focus on stocks listed on the London Stock Exchange instead of American stocks. There are two reasons for that. One is that we are not limited to American stocks only when it comes to auto-generated algo-based technical analysis and recommendations. We cover stocks for 12 countries worldwide. The second reason is that we found some interesting stocks listed on LSE that could turn out to be good bets in the coming weeks and months.
We first chose some criteria, based on which we found three stocks. Under our stock selection option, we filtered for liquidity, set at 75 million pence or above, volatility between 6 and 16, so we do not end up with very low or very high volatility stocks, and lastly if they were technically positive or negative.
CENTRICA PLC (CNA.L) Close: 153.10
 Centrica Plc is inside a rising trend channel on the medium term graph. The stock has taken good support around the 142 area since March this year.
In the graph there is shown this head and shoulders formation under construction. But this formation has little or no meaning at this particular area. Why? As per theory, this formation could be of importance if preceeded by a price rise. This is not the case here. Hence we can overlook it at the moment.
While I write, this stock is up by 0.5 per cent at 9.30 GMT. There is resistance around 164 pence. A close above that level would be a positive sign and may initiate new buying.
On the downside there is support around 142. A stop-loss can be maintained under that level if the price closes below it.
The stock's monthly average turnover is for over 30 million pounds, while volatility stands a little under 10 per cent.
Investtech's outlook (one to six months): Buy
FRESNILLO PLC (FRES.L) Close: 902.00
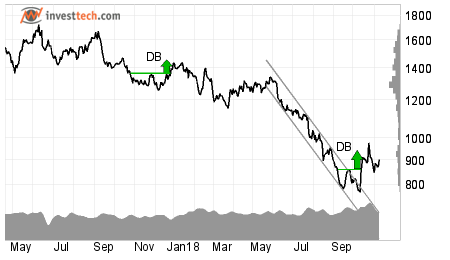 Fresnillo Plc has been chosen as a positive candidate in the medium term and reacted strongly up.
Recently, Fresnillo Plc broke out through the ceiling of the downtrend channel. For the time being, it is difficult to say anything about the future trend direction, but a sequence of rising tops and bottoms can lead to a change in trend or a new uptrend.
There was initiated a buy signal from a double-bottom formation in the middle of October. The price target from the formation has been met, but the formation indicates that the price may continue to rise if not reversed otherwise.
This recent price move has been supported by high volume, which suggests that buyers have been agressive while sellers were passive. Also the momentum indicator RSI is rising and indicates rising optimism among investors.
Fresnillo Plc has medium term resistance around 1150 pence or 27 per cent higher than yesterday's close, while downside is 14 per cent below at 770 pence. More conservative traders can refer to shorter term support and resistance levels as marked in the short term graph. The stock has a monthly average volatility of a little under 14 per cent.
Investtech's outlook (one to six months): Buy
WILLIAM HILL PLC (WMH.L) Close: 194.25
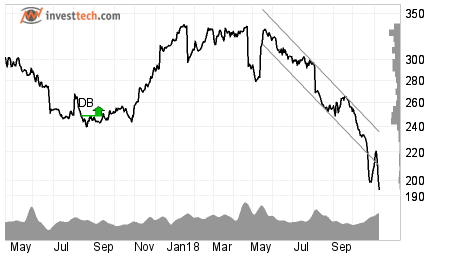 William Hill Plc is traded for over 12 million pounds on a monthly average basis, with volatility around 11 per cent. WILLIAM HILL PLC has broken the falling trend channel down in the medium term. Falling trends indicate that the company experiences negative development and that buy interest among investors is declining.
Investtech's research done on trends in the Nordic region suggests that stocks that have broken down from the bottom of the falling trend channel, continue to fall in the near term future. For over 4400 samples between 1996 and 2015, such signals have given a negative return of -27.9 percentage points annalized excess return.
Hence this break downwards from the trend channel in William Hill Plc may indicate an even stronger falling rate.
Volume balance and momentum indicators support the downfall.
In the short term there is resistance between 200 and 221 pence in case of a price reaction on the upside. On the downside there is no clear support on the medium term chart. And the next pivot point as shown in the longer term chart is 156 pence. The stock is overall assessed as technically negative for the medium term.
Investtech's outlook (one to six months): Sell
The analyses are based on closing price as per November 7, 2018.
Skrevet af

Analytiker
i Investtech
"Investtech analyserer psykologien i markedet og giver dig konkrete tradingforslag hver dag."

Partner & Senior Advisor - Investtech


Investeringsanbefalinge(r)n(e) er udarbejdet af Investtech.com AS ("Investtech"). Investtech garanterer ikke for fuldstændigheden eller rigtigheden af analysen. Eventuel eksponering i forhold til de råd / signaler, som fremkommer i analyserne, står helt og holdent for investors regning og risiko. Investtech er hverken direkte eller indirekte ansvarlig for tab, der opstår som følge af brug af Investtechs analyser. Oplysninger om eventuelle interessekonflikter vil altid fremgå af investeringsanbefalingen. Yderligere information om Investtechs analyser findes på infosiden.
Investeringsanbefalinge(r)n(e) er udarbejdet af Investtech.com AS ("Investtech"). Investtech garanterer ikke for fuldstændigheden eller rigtigheden af analysen. Eventuel eksponering i forhold til de råd / signaler, som fremkommer i analyserne, står helt og holdent for investors regning og risiko. Investtech er hverken direkte eller indirekte ansvarlig for tab, der opstår som følge af brug af Investtechs analyser. Oplysninger om eventuelle interessekonflikter vil altid fremgå af investeringsanbefalingen. Yderligere information om Investtechs analyser findes på infosiden.
Copyright Ⓒ 1997-2024 Investtech.com AS, Org nr 978 655 424 MVA Persondataforordning | Ansvarsfraskrivelse
Hovedkontor
Strandveien 171366 Lysaker, Norway
Forskningsafdeling
Instituttveien 102007 Kjeller, Norway