
 Oslo Børs
 Stockholmsbörsen
 Københavns Fondsbørs
Investeringsforeninger
Københavns Fondsbørs
Investeringsforeninger
 Helsingin pörssi
 World Indices
 US Stocks
US 30
Nasdaq 100
US 500
US Stocks
US 30
Nasdaq 100
US 500
 Toronto Stock Exchange
 London Stock Exchange
 Euronext Amsterdam
 Euronext Brussel
 DAX
SDAX
TECDAX
Frankfurt
CDAX
MDAX
Prime Standard
DAX
SDAX
TECDAX
Frankfurt
CDAX
MDAX
Prime Standard
 CAC 40
 Mumbai S.E.
National S.E.
Mumbai S.E.
National S.E.
 Commodities
 Currency
 Cryptocurrency
 Exchange Traded Funds
 Investtech Indices
Buy signal in this one cannot be missed
Published November 15, 2018
While I am writing this report, Nifty 50 index is over the resistance of 10600 points. But this is not enough. It must close above this level to give us any hope that the short term scenario is turning positive.
Meanwhile we landed up on the Cummins India Limited chart. It may turn out to be a solid opportunity in the coming days or weeks.
Cummins India Limited (CUMMINSIND.NS) Close: 789.90
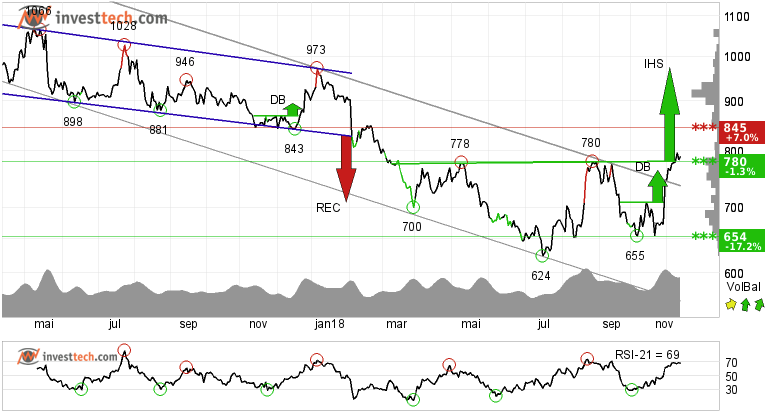
Cummins India Limited has broken the ceiling of the falling trend in the medium term. The stock has very recently given a breakout from a small double bottom formation and a bigger inverted head and shoulders formation which extends over nine months.
At the same time the stock is above its resistance of 780 rupees. A buy signal has been generated and the formation gives a price target of 936 rupees in the coming weeks or months.
Positive volume balance suggests that buyers are coming in with every price rise, while sellers are now getting hesitant to sell at lower price. Positive and rising momentum as indicated by high RSI value suggests that buy interest among investors is rising and the stock may continue to rise.
The stock has resistance around 845 levels, but if the price manages to close above that level, it may go up to our price formation target of 936 or more. In case of a reaction on the downside, there is support around 780 rupees.
Investtech's outlook (one to six months): Positive
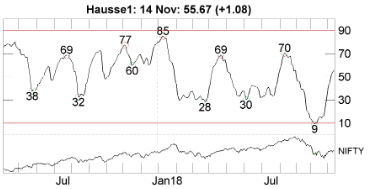
The Hausse indices are indicators of optimism. They show the ratio of investors who are positive in the market.
The above graph and table suggest that buy interest is rising and show optimism among investors in the short term. More investors are positive than last week.
More about the Hausse Index can be found here.
The analyses are based on closing price as per November 14, 2018. Maintaining proper stop loss is always recommended.
Skrevet af

Analytiker
i Investtech
Archive:
13 November: Big auto stocks comparison
09 November: What to wait for?
06 November: Banking stocks look positive
02 November: Positive on this one
01 November: TECHM, NIFTY50 and Hausse
31 October: What are investors thinking?
30 October: Bullish on these three stocks
26 October: Three potential candidates to ride on
24 October: Three big Metal stocks, Seasonal variation
22 October: Among top performers on our Top 50 list
18 October: Three stocks investors should stay away from
17 October: Flowing against the tide
16 October: Positive on these 2 stocks
11 October: Over 45 per cent rise
9 October: The Indian banking space
5 October: Nifty closes at a crucial level
2 October: Price formations in the long-term charts
28 September: Positive on Biocon Limited
"Investtech analyserer psykologien i markedet og giver dig konkrete tradingforslag hver dag."

Partner & Senior Advisor - Investtech


Investeringsanbefalinge(r)n(e) er udarbejdet af Investtech.com AS ("Investtech"). Investtech garanterer ikke for fuldstændigheden eller rigtigheden af analysen. Eventuel eksponering i forhold til de råd / signaler, som fremkommer i analyserne, står helt og holdent for investors regning og risiko. Investtech er hverken direkte eller indirekte ansvarlig for tab, der opstår som følge af brug af Investtechs analyser. Oplysninger om eventuelle interessekonflikter vil altid fremgå af investeringsanbefalingen. Yderligere information om Investtechs analyser findes på infosiden.
Investeringsanbefalinge(r)n(e) er udarbejdet af Investtech.com AS ("Investtech"). Investtech garanterer ikke for fuldstændigheden eller rigtigheden af analysen. Eventuel eksponering i forhold til de råd / signaler, som fremkommer i analyserne, står helt og holdent for investors regning og risiko. Investtech er hverken direkte eller indirekte ansvarlig for tab, der opstår som følge af brug af Investtechs analyser. Oplysninger om eventuelle interessekonflikter vil altid fremgå af investeringsanbefalingen. Yderligere information om Investtechs analyser findes på infosiden.
Copyright Ⓒ 1997-2024 Investtech.com AS, Org nr 978 655 424 MVA Persondataforordning | Ansvarsfraskrivelse
Hovedkontor
Strandveien 171366 Lysaker, Norway
Forskningsafdeling
Instituttveien 102007 Kjeller, Norway