
 Oslo Børs
 Stockholmsbörsen
 Københavns Fondsbørs
Investeringsforeninger
Københavns Fondsbørs
Investeringsforeninger
 Helsingin pörssi
 World Indices
 US Stocks
US 30
Nasdaq 100
US 500
US Stocks
US 30
Nasdaq 100
US 500
 Toronto Stock Exchange
 London Stock Exchange
 Euronext Amsterdam
 Euronext Brussel
 DAX
SDAX
TECDAX
Frankfurt
CDAX
MDAX
Prime Standard
DAX
SDAX
TECDAX
Frankfurt
CDAX
MDAX
Prime Standard
 CAC 40
 Mumbai S.E.
National S.E.
Mumbai S.E.
National S.E.
 Commodities
 Currency
 Cryptocurrency
 Exchange Traded Funds
 Investtech Indices
OMX Helsinki (HEX.HEX)
Viimeinen päätöskurssi: 9 978.25 (+35.99), 23. huhti 2024
Complete report
Algorithmic Overall Analysis
Osto (Pistesumma: 84)
23. huhti 2024. Updated daily.
Analyysit

Lyhyt
Keskipitkä

Pitkä
Kokonaisanalyysi
Investor Psychology - Behavioural Finance - Quantitative Analysis - Scientific Methods
Technical Analysis - Insider Trades - Seasonal Variations - Intraday Trading
Stock data
| Price date | 23. huhti 2024 |
| Valuutta | EUR |
| ISIN | FI0008900006 |
| Rise from year low | 11.14% |
| Fall from year high | -6.71% |
Automatic technical analysis. Lyhyt
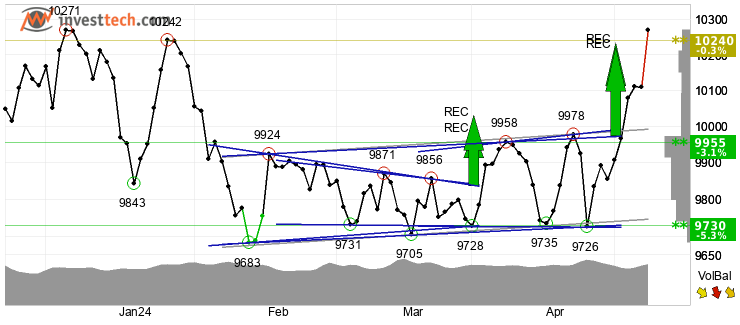
Lyhyt aikaväli
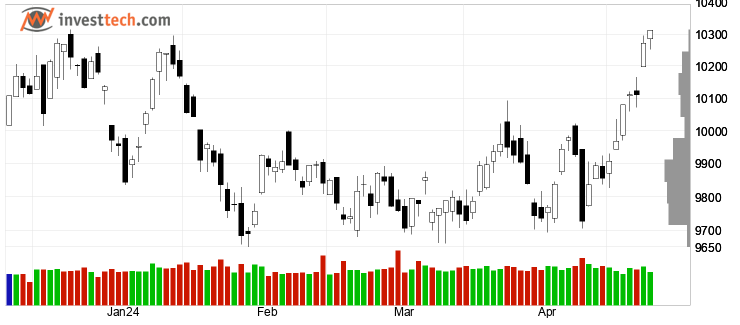
Osakkeen kurssi on läpäissyt laskutrendin vastuslinjan. Tämä indikoi hidastuvaa laskunopeutta tulevaisuudessa. Osakkeen kurssi on rikkonut suorakulmiokuvion vastuslinjan 9966 euron kohdalla, mikä ennakoi nousun jatkuvan. Osakkeen kurssi on myös noussut läpi suorakulmiokuvion vastustason 9837. Tason läpäisy antaa ostosignaalin ja indikoi nousun jatkuvan 10031 tasolle tai pidemmälle. Indeksi on rikkoutunut ylös vastustason läpi n. 9955 pisten kohdalla. Näin ollen on signalisoitu edelleen tapahtuvaa nousua ja jos reaktioita takaisinpäin tapahtuu, on tukitaso nyt 9955 piste. RSI-käyrä näyttää nousevaa trendiä, mikä voi olla aikainen signaali nousevan trendin alkamisesta. Osaketta pidetään kokonaisuutena teknisesti positiivisena lyhyellä aikavälillä.Recommendation one to six weeks: Osto (Pistesumma: 92)
Automatic technical analysis. Keskipitkä tähtäin
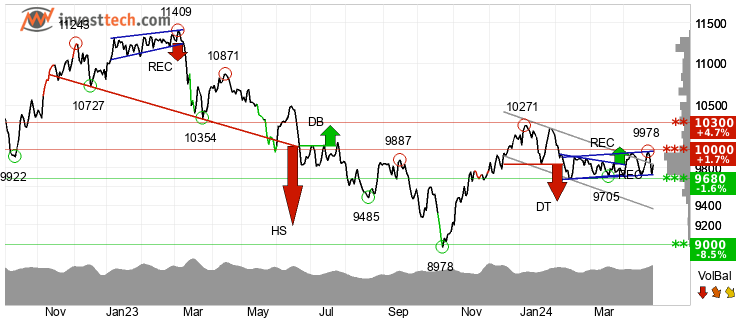
Keskipitkä tähtäin
Osakkeen kurssi on läpäissyt laskutrendin vastuslinjan. Tämä indikoi hidastuvaa laskunopeutta tulevaisuudessa. Osakkeen kurssi on noussut läpi suorakulmiokuvion vastustason 9837. Tason läpäisy antaa ostosignaalin ja indikoi nousun jatkuvan 10031 tasolle tai pidemmälle. Indeksi on rikkoutunut ylös vastustason läpi n. 9850 pisten kohdalla ja näin ollen on signalisoitu edelleen tapahtuvaa nousua. RSI-käyrä näyttää nousevaa trendiä, mikä voi olla aikainen signaali nousevan trendin alkamisesta. Osaketta pidetään kokonaisuutena teknisesti positiivisena keskipitkällä aikavälillä.Recommendation one to six months: Osto (Pistesumma: 81)
Automatic technical analysis. Pitkä
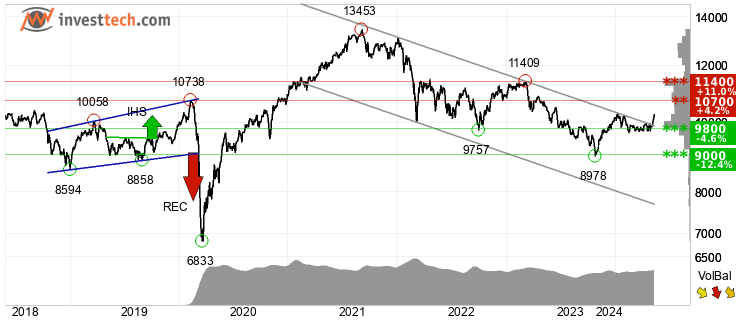
Pitkä aikaväli
Osakkeen kurssi on rikkonut laskutrendikanavan vastuslinjan. Tämä indikoi hitaampaa laskunopeutta aluksi, tai horisontaalimman kehityksen alkua. Indeksi on rikkoutunut ylös vastustason läpi n. 9800 pisten kohdalla ja näin ollen on signalisoitu edelleen tapahtuvaa nousua. Osaketta pidetään teknisesti heikosti positiivisena pitkällä aikavälillä.Recommendation one to six quarters: Heikko ostosuositus (Pistesumma: 36)
Max
Candlesticks 95 days
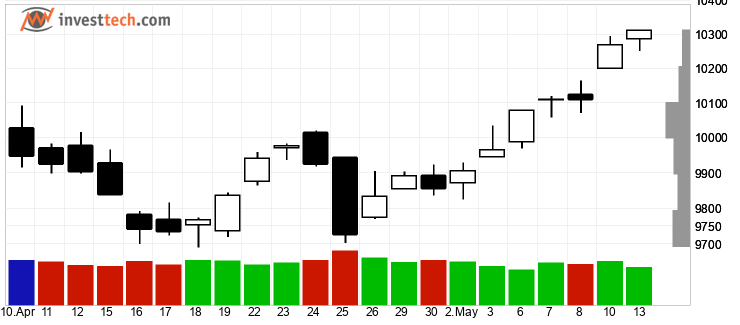
Candlesticks 22 days
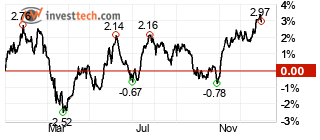
Seasonal variations
Seasonal prediction from today's date
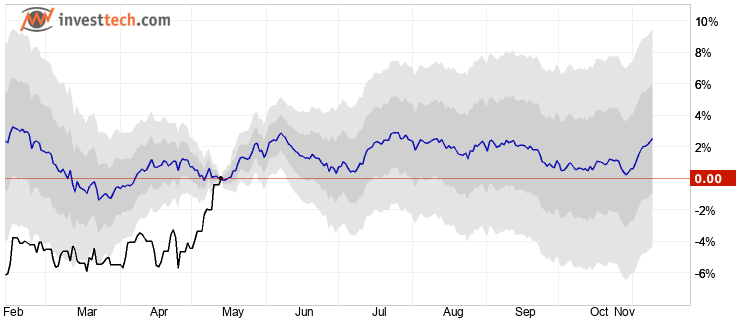
The blue line shows average price development the past 10 years, in the period from three months before to six months after today's date. The black line is actual price development in the past three months. Shaded areas are one and two standard deviations.
Monthly and annual statistics
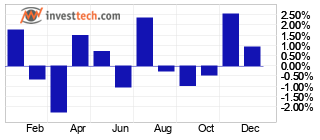
Average development per month, last 10 years
Average development throughout the year, last 10 years
Annual development from 2014 to 2023
2014
2015
2016
2017
2018
2019
2020
2021
2022
2023
Varoituspalvelu
| Seuraavan päivän loppukurssit, jotka rikottaessa laukaisevat uusia signaaleja |  | |
|---|---|---|
| Indikaattori | Kurssi | Objektiivinen |
| Korkea RSI | 10 142.46 | - |
| Viimeinen päätöskurssi | 9 978.25 | - |
| Lyhyen aikavälin kaupankäyntiväli | 9 735.18 | - |
| Pitkän aikavälin kaupankäyntiväli | 9 705.34 | - |
| Alhainen RSI | 9 061.51 | - |
| Liukuva keski. | 6 123.22 | - |
| Indikaattori: | Osto- tai myyntisignaalityyppi | |
| Kurssi: | Jos seuraavan päivän loppukurssi rikkoo tämän arvon, annetaan tekninen signaali | |
| Objektiivinen: | Kurssitavoite osto- tai myyntisignaalille (Annettu vain kuvioille) | |
Hälytykset
| Päivämäärä | Kurssi | Signal | Aikahorisontti | Tavoitekurssi |
|---|---|---|---|---|
| 23. huhti 2024 | 9 978.25 | Suorakulmio | Lyhyt | 9 999.99 |
Key ratios
Data missingOhjeita ja tietoja - Research shows the importance of Trend, Momentum and Volume
Investtechs analyses focus on a stocks trend status, short term momentum and volume development. These are central topics of technical analysis theory that describe changes in investor optimism or fluctuations in a companys financial development. However, Investtechs strong focus on these elements is due to research results that clearly indicate causation between these factors and future return on the stock market.
Trend

Theory: Stocks in rising trends will continue to rise.
Psychology/economy: Rising trends indicate that the company experiences positive development and increasing buy interest among investors. Read more
Research: Stocks in rising trend channels in Investtechs medium long term charts have been followed by an annualized excess return of 7.8 percentage points compared to average benchmark development. This is shown by Investtechs research into 34,880 cases of stocks in rising trends on the Nordic Stock Exchanges in the period 1996 to 2015.
Read more about the research results here
Momentum

Theory: Stocks with rising short term momentum will continue to rise. Stocks with very strong momentum (overbought) will react backwards.
Psychology/economy: RSI above 70 shows strong positive momentum. The stock has risen in the short term without any significant reactions downwards. Investors have kept paying more to buy stocks. This indicates that more investors want to buy the stock and that the price will continue to rise. Read more
Research: Stocks with strong momentum have on average continued to rise, and more so than the average stock listed on the Exchange. This is shown by Investtechs research into 24,208 cases of stocks on the Nordic Stock Exchanges in the period 1996 to 2015 where RSI went above 70 points, indicating strong and increasing short term momentum. On average, annualized, the stocks rose the equivalent of 11.4 percentage points more than the average stock.
Read the research report here
Volume

Theory: Rising prices on high volume and falling prices on low volume indicate strength in a stock. Volume can confirm a rising trend or signal that a falling trend is ending.
Psychology/economy: When investors very much want to buy a stock, they have to increase the price to find new sellers. Rising price on high volume shows that some investors are so aggressive that they push the price up to be able to buy the stock. Investtechs Volume Balance tool measures the relation between price rise and volume and measures investor aggression at rising and falling prices. Read more
Research: Stocks with volume balance above 40 have been followed by an average annual return of 4.7 percentage points on the Nordic Stock Exchanges, shown by research conducted by Investtech into 24,580 cases.
Read the research report here
Investtech's analyses
Investtech has combined theory, psychology and research into powerful investment tools.
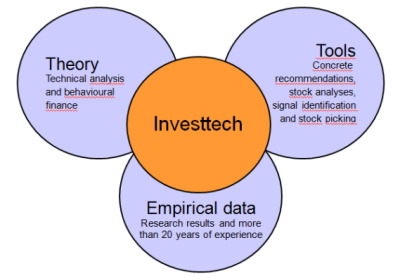
About Investtech
Investtech are behavioural finance and quantitative stock analysis specialists. The company sells analysis products to private, professional and institutional investors. Investtech manage the AIFM company Investtech Invest, which invests customers funds in the stock market.
Investtechs computers analyze more than 28,000 stocks from 12 different countries every day. The analyses are presented in eight languages and sold to customers worldwide. In addition to the automatic analyses, the companys analysts present subjective assessments and recommendations for some markets. The analyses are available to customers in the form of daily morning reports and cases, and weekly market updates and model portfolios.
Investtechs algorithms for analysis, ranking and stock recommendations are based on research dating back to 1993. Part of the research was conducted in cooperation with Oslo University and the Norwegian Research Council. Research still has high priority for Investtech. Many of the companys research results are available for customers on the companys web site.
The companys basic product starts at approx. 30 euro per month. Investtech also provides bespoke products for integration on partners web sites and for use in newsletters, for example to stock brokers and the media. Contact us by e-mail to info@investtech.com or by phone +47 21 555 888 for more information. A free trial subscription is available to order on our web site www.investtech.com.

Head Office
Investtech ASStrandveien 17
1366 Lysaker
adr.officeAddress04
+47 21 555 888
Postal address
Investtech ASStrandveien 17
1366 Lysaker
adr.postAddress04
info@investtech.com
VAT no. 978 655 424 MVA
Research Department
Instituttveien 102007 Kjeller
adr.researchAddress03
adr.researchAddress04
www.investtech.com
Investor Psychology - Behavioural Finance - Quantitative Analysis - Scientific Methods
Technical Analysis - Insider Trades - Seasonal Variations - Intraday Trading
Investtech ei takaa analyysien tarkkuutta tai kattavuutta. Kaikkien analyysien tuottamien neuvojen ja signaalien käyttäminen on täysin käyttäjän vastuulla. Investtech ei vastaa mistään tappioista, jotka saattavat syntyä Investtechin analyysien käytön seurauksena. Mahdollisten eturistiriitojen yksityiskohdat mainitaan aina sijoitusneuvon yhteydessä. Lisätietoja Investtechin analyyseistä löytyy täältä disclaimer.
Investtech ei takaa analyysien tarkkuutta tai kattavuutta. Kaikkien analyysien tuottamien neuvojen ja signaalien käyttäminen on täysin käyttäjän vastuulla. Investtech ei vastaa mistään tappioista, jotka saattavat syntyä Investtechin analyysien käytön seurauksena. Mahdollisten eturistiriitojen yksityiskohdat mainitaan aina sijoitusneuvon yhteydessä. Lisätietoja Investtechin analyyseistä löytyy täältä disclaimer.
Päätoimisto
Strandveien 171366 Lysaker, Norway
Tutkimusosasto
Instituttveien 102007 Kjeller, Norway
×
