
 Oslo Børs
 Stockholmsbörsen
 Københavns Fondsbørs
Investeringsforeninger
Københavns Fondsbørs
Investeringsforeninger
 Helsingin pörssi
 World Indices
 US Stocks
US 30
Nasdaq 100
US 500
US Stocks
US 30
Nasdaq 100
US 500
 Toronto Stock Exchange
 London Stock Exchange
 Euronext Amsterdam
 Euronext Brussel
 DAX
SDAX
TECDAX
Frankfurt
CDAX
MDAX
Prime Standard
DAX
SDAX
TECDAX
Frankfurt
CDAX
MDAX
Prime Standard
 CAC 40
 Mumbai S.E.
National S.E.
Mumbai S.E.
National S.E.
 Commodities
 Currency
 Cryptocurrency
 Exchange Traded Funds
 Investtech Indices
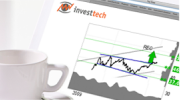
Buy signal from rectangle formation in a rising trend
A rising trend indicates that investors are more positive and that the price will continue to rise within the trend channel. Additionally, a buy signal from a rectangle formation indicates short term rise as well.
Theory: As described under "Rising trend and price near support", a stock within a rising trend is expected to continue rising. When a rectangle formation develops, a resistance is formed with sellers near the ceiling of the rectangle. When the price rises through the resistance this means that these sellers have been exhausted. The buying side is still the same size, but there is now a lack of sellers such that the price is driven higher. If one acts quickly and buys near the support (the old resistance) of the rectangle, one gets a good buying price and can place a tight stop loss. If the price has risen substantially after the break of the rectangle, it may be better to await a reaction back before buying.
Score: The formation's and the trend's quality, i.e. the similarity to a theoretically perfect formation and trend, are important for computing the score. The size of the formation and how long ago it was broken are also important contributors to the score. A price near the support of the formation results in a higher score than a price near the price target of the formation. If the price has reacted back below the support line after the break, this is negative. It is also negative if other formations have been formed after the break.
Buying price: Is set to the support of the formation and a little up (about 20 % of the height of the formation).
Price target: Is set to 90-125 % of the price target from the formation break.
Stop loss: Is set to 20 % of the height of the formation below the signal level of the formation, i.e. about a fifth down in the formation. For more flexibility, a stop loss can be placed just below the middle of the formation.
Time horizon: From 40 % to 80 % of the formation's height.


Investtech ei takaa analyysien tarkkuutta tai kattavuutta. Kaikkien analyysien tuottamien neuvojen ja signaalien käyttäminen on täysin käyttäjän vastuulla. Investtech ei vastaa mistään tappioista, jotka saattavat syntyä Investtechin analyysien käytön seurauksena. Mahdollisten eturistiriitojen yksityiskohdat mainitaan aina sijoitusneuvon yhteydessä. Lisätietoja Investtechin analyyseistä löytyy täältä disclaimer.
Investtech ei takaa analyysien tarkkuutta tai kattavuutta. Kaikkien analyysien tuottamien neuvojen ja signaalien käyttäminen on täysin käyttäjän vastuulla. Investtech ei vastaa mistään tappioista, jotka saattavat syntyä Investtechin analyysien käytön seurauksena. Mahdollisten eturistiriitojen yksityiskohdat mainitaan aina sijoitusneuvon yhteydessä. Lisätietoja Investtechin analyyseistä löytyy täältä disclaimer.
Päätoimisto
Strandveien 171366 Lysaker, Norway
Tutkimusosasto
Instituttveien 102007 Kjeller, Norway