
 Oslo Børs
 Stockholmsbörsen
 Københavns Fondsbørs
Investeringsforeninger
Københavns Fondsbørs
Investeringsforeninger
 Helsingin pörssi
 World Indices
 US Stocks
US 30
Nasdaq 100
US 500
US Stocks
US 30
Nasdaq 100
US 500
 Toronto Stock Exchange
 London Stock Exchange
 Euronext Amsterdam
 Euronext Brussel
 DAX
SDAX
TECDAX
Frankfurt
CDAX
MDAX
Prime Standard
DAX
SDAX
TECDAX
Frankfurt
CDAX
MDAX
Prime Standard
 CAC 40
 Mumbai S.E.
National S.E.
Mumbai S.E.
National S.E.
 Commodities
 Currency
 Cryptocurrency
 Exchange Traded Funds
 Investtech Indices
Global stocks: Buy or Sell? Five Indian stocks
Published September 18, 2019
The global markets are showing no clear signs that they are moving in tandem with one another. Some markets are performing very well, like the US and a few European markets, while others like India and Hong Kong are struggling to hold a solid ground. The theory of markets behaving like each other cannot really hold because of the very nature of their economies. Some economies are heavily dependent on oil, like Norway is dependent on oil and fish export while India imports crude oil, and are very vulnerable to the changing oil prices.
Moving on to our topic today, which is whether to buy or sell the below mentioned stocks. They have either given a breakout from a price formation or are in a position from where they can easily move in one direction. Investtech has done some significant research into the European and Indian markets. As per research done by Investtech for India (NSE only), stocks that have broken upwards from rectangle formations have on average had clearly positive price development the following 66 days, with an increase of 4.9 per cent. This is an excess return of 1.8 percentage points compared to benchmark, which on average increased by 3.1 per cent. More on this can be studied here.
Petronet LNG Limited (PETRONET.NS) Close: 263.00
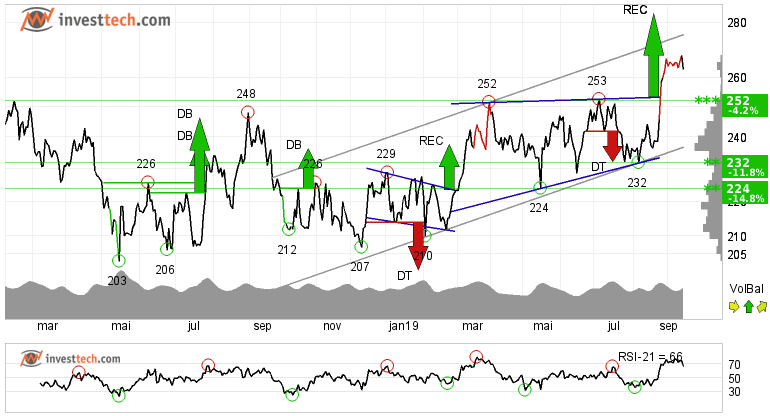
Investors have paid higher prices over time to buy Petronet LNG Limited and the stock is in a rising trend channel in all time frames: short, medium and long term. This signals increasing optimism among investors and indicates continued rise.
The stock gave a price breakout from a rectangle formation both in the medium and long term. Further rise to 283 or more is signalled. There is no resistance in the price chart and further rise is indicated. In case of a negative reaction, the stock has support at approximately 252 rupees.
Strong momentum is a sign of strength. Also, positive volume balance indicates that buyers are aggressive while sellers are passive, and strengthens the stock.
Investtech's outlook (one to six months): Positive
Titan Company Limited (TITAN.NS) Close: 1158.25
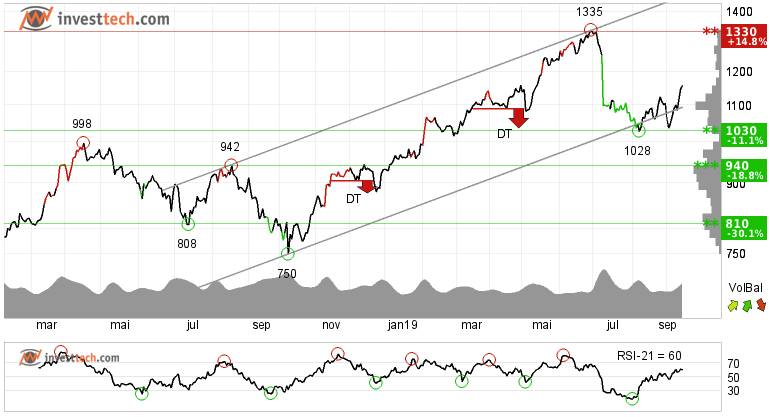
Titan Company Limited shows strong development within a rising trend channel in the medium long term. Rising trends indicate that the company experiences positive development and that buy interest among investors is increasing. After a correction from its peak around 1335 rupees, the stock has recovered and has moved inside the rising trend channel again.
The stock has broken a resistance level of 1123 rupees in the short term. There is now resistance around 1335 and support is between 1123 and 1035.
Volume balance is positive, suggesting that more people are buying with rising price and fewer people are willing to sell when the price dips. This is a positive signal.
Investtech's outlook (one to six months): Positive
Natco Pharma Limited (NATCOPHARM.NS) Close: 567.60
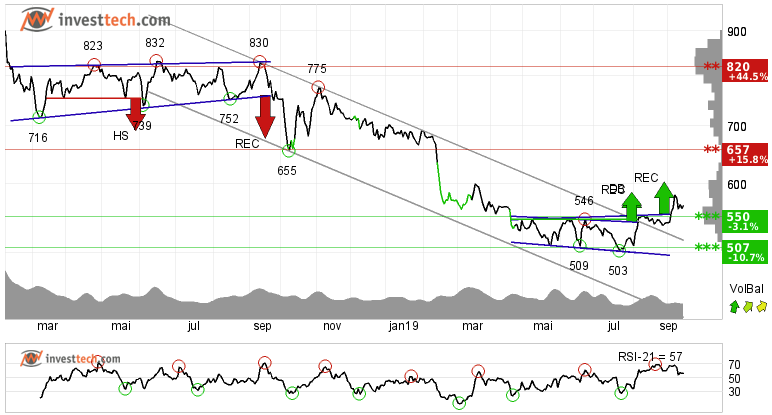
Natco Pharma Limited has broken through the ceiling of a falling trend channel in the medium term. This indicates a slower falling rate initially, or the start of a more horizontal development. However, the stock has given a positive signal from a rectangle formation by a break up through resistance at 554. Further rise to 603 or more is signalled. The stock is approaching support at 550 rupee, which may give a positive reaction. Next resistance is around 657 rupees, almost 16 per cent from Tuesday's close.
Investtech's outlook (one to six months): Positive
Canara Bank (CANBK.NS) Close: 194.05
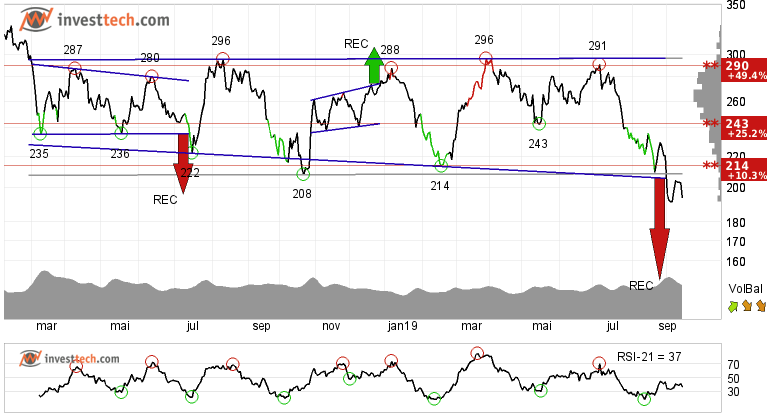
Canara Bank has broken through an approximate horizontal trend channel in the medium term and is inside a falling trend channel in the short and long term charts. A continued weak development is indicated, and the stock now meets resistance on possible reactions up towards the trend lines.
It also gave a negative signal from a rectangle formation, both in the medium and long term charts, via a break down through the support at 206. Further fall to 151 or lower is signalled. There is no clear support in the price chart and further decline is indicated, while in the longer term chart support is around 158-160 rupees. In case of a positive reaction, the stock has resistance at 214 rupee.
Slightly negative volume balance suggests that pessimists are outweighing optimists. RSI is below 30 after the falling prices of the past weeks. The stock has strong negative momentum and further decline is indicated. The stock is overall assessed as technically negative for the medium to long term.
Investtech's outlook (one to six months): Negative
United Breweries Limit (UBL.NS) Close: 1255.35
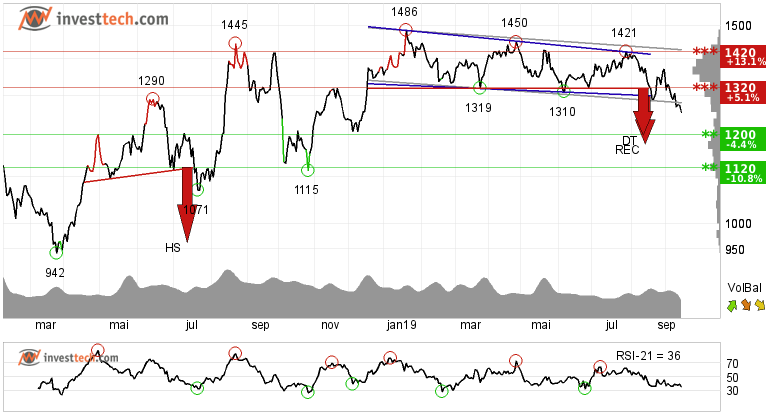
Similar to the chart of Canara Bank, United Breweries Limited has also broken down through a sideways trend and a rectangle formation both in the medium and long term charts. The price target from the price formation is given as 1175 rupees or lower.
The annualised excess return for all NSE stocks (in excess to the benchmark index Nifty 50) that had given a sell signal by breaking downwards from rectangle formation is -15 percentage points.
On the downside the stock has support around 1200 and 1120 rupees. While in case of an upside reaction, there is resistance around the 1320 level. Negative volume balance and falling momentum support the price breakdown. The stock is overall assessed as technically negative in the medium term.
Investtech's outlook (one to six months): Negative
Like Canara Bank, similar price formation or price behaviour has been seen in many other Indian banking stocks and Axis Bank is one of them.
Today's analyses focus on the medium to long term. The analyses are based on closing price as per September 17, 2019.
These instruments are traded in currency based on the Exchange or country they are listed on.
Kirjoittaja

Analyst
Investtech
"Investtech analysoi markkinoiden psykologiaa ja antaa konkreettisia kaupankäyntisuosituksia päivittäin."

Partner & Senior Advisor - Investtech


Investtech ei takaa analyysien tarkkuutta tai kattavuutta. Kaikkien analyysien tuottamien neuvojen ja signaalien käyttäminen on täysin käyttäjän vastuulla. Investtech ei vastaa mistään tappioista, jotka saattavat syntyä Investtechin analyysien käytön seurauksena. Mahdollisten eturistiriitojen yksityiskohdat mainitaan aina sijoitusneuvon yhteydessä. Lisätietoja Investtechin analyyseistä löytyy täältä disclaimer.
Investtech ei takaa analyysien tarkkuutta tai kattavuutta. Kaikkien analyysien tuottamien neuvojen ja signaalien käyttäminen on täysin käyttäjän vastuulla. Investtech ei vastaa mistään tappioista, jotka saattavat syntyä Investtechin analyysien käytön seurauksena. Mahdollisten eturistiriitojen yksityiskohdat mainitaan aina sijoitusneuvon yhteydessä. Lisätietoja Investtechin analyyseistä löytyy täältä disclaimer.
Päätoimisto
Strandveien 171366 Lysaker, Norway
Tutkimusosasto
Instituttveien 102007 Kjeller, Norway