
 Oslo Børs
 Stockholmsbörsen
 Københavns Fondsbørs
Investeringsforeninger
Københavns Fondsbørs
Investeringsforeninger
 Helsingin pörssi
 World Indices
 US Stocks
US 30
Nasdaq 100
US 500
US Stocks
US 30
Nasdaq 100
US 500
 Toronto Stock Exchange
 London Stock Exchange
 Euronext Amsterdam
 Euronext Brussel
 DAX
SDAX
TECDAX
Frankfurt
CDAX
MDAX
Prime Standard
DAX
SDAX
TECDAX
Frankfurt
CDAX
MDAX
Prime Standard
 CAC 40
 Mumbai S.E.
National S.E.
Mumbai S.E.
National S.E.
 Commodities
 Currency
 Cryptocurrency
 Exchange Traded Funds
 Investtech Indices
Investtech Research: Sell signals from double top formations have little signal power
Published 16 December 2019
Geometric price patterns, like double top formations, are used in technical stock analysis to predict future price development. New research results from Investtech indicate that sell signals from double top formations have little signal power and can be ignored in stock analyses.
Identification of geometric price patterns in stock prices is an important area of technical analysis. The idea is that these patterns describe the investors mental state, i.e. whether they will want to sell or buy stocks in the time ahead, and they thereby indicate the future direction of the stock price. Double top formations are one type of such patterns.
A double top formation indicates the end of a rising trend. When a double top formation is formed, it mirrors increasing pessimism among investors and indicates that the stock enters a falling trend. Double top formations are used to predict long term market trend reversals, but are also used in the shorter term.
Investtechs algorithms identify such formations for you. In our price charts, double top formations are shown by code DT and a red downwards arrow. The arrow shows theoretical price target. A current example may be Apple, which triggered a negative signal from a double top formation on December 3rd.
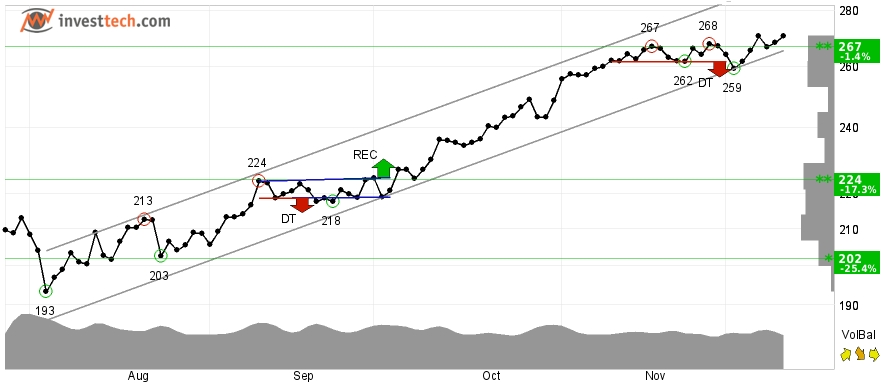
Figure 1:Apple (AAPL.US) Close: 270.77 (+2.29), Dec 11, 2019
Our subscribers can find stocks with these negative signals using for instance the tool Signals.
We wanted to study the statistical results yielded by these sell signals and therefore studied return from Norwegian, Swedish, Danish and Finnish stocks following buy signals from double bottom formations and sell signals from double top formations identified in Investtechs price charts in the short, medium and long term. We had up to 23 years of data, from 1996 to 2018.
The chart below shows average price development following sell signals from double top formations identified in Investtechs short term price charts in the Nordic markets. The signals are triggered on day 0. Only days when the exchange is open are included, so 66 days equal approximately three months. The thick red line shows the development of sell signal stocks. The shaded areas are the standard deviation of the calculations. The thin red line shows benchmark development in the same period as the buy signal stocks.
Figure 2: Return following sell signals from double top formations, short term. Nordic markets combined.
Sell signals from short term double top formations have given an excess return of 0.3 percentage points after one month, equal to an annualised excess return of 3.9 percentage points.
Sell signals from medium term double top formations have given an excess return of 0.3 percentage points in three months, equal to an annualised excess return of 1.3 percentage points.
In the long term, sell signals from double top formations have given a negative excess return of 1.5 percentage points in three months, equal to an annualised negative excess return of 5.7 percentage points. However, t-value after 66 days was a mere 1.9, and the combined results are not considered clear enough to establish statistical coherence.
The analysis suggests that both short and medium term double top formations are the result of noise and normal variations in stocks prices and are merely small breaks in more long term rising trends. Such signals have little signal power and can probably be ignored for analysis purposes. Sell signals from long term double top formations indicate future negative excess return for the signal stocks compared to benchmark.
Please find more details and results in the research reports here (available to subscribers on the Professional and Institutional levels):
Double top/bottom formations, short term
Double top/bottom formations, medium term
Double top/bottom formations, long term
Kirjoittaja

Perustaja ja tutkimustyön johtaja
Investtech
Article on sell signals:
Buy signals from short term double bottom formations contradict established technical analysis theory
Insight & Skills:
"Investtech analysoi markkinoiden psykologiaa ja antaa konkreettisia kaupankäyntisuosituksia päivittäin."

Partner & Senior Advisor - Investtech


Investtech ei takaa analyysien tarkkuutta tai kattavuutta. Kaikkien analyysien tuottamien neuvojen ja signaalien käyttäminen on täysin käyttäjän vastuulla. Investtech ei vastaa mistään tappioista, jotka saattavat syntyä Investtechin analyysien käytön seurauksena. Mahdollisten eturistiriitojen yksityiskohdat mainitaan aina sijoitusneuvon yhteydessä. Lisätietoja Investtechin analyyseistä löytyy täältä disclaimer.
Investtech ei takaa analyysien tarkkuutta tai kattavuutta. Kaikkien analyysien tuottamien neuvojen ja signaalien käyttäminen on täysin käyttäjän vastuulla. Investtech ei vastaa mistään tappioista, jotka saattavat syntyä Investtechin analyysien käytön seurauksena. Mahdollisten eturistiriitojen yksityiskohdat mainitaan aina sijoitusneuvon yhteydessä. Lisätietoja Investtechin analyyseistä löytyy täältä disclaimer.
Päätoimisto
Strandveien 171366 Lysaker, Norway
Tutkimusosasto
Instituttveien 102007 Kjeller, Norway