
 Oslo Børs
 Stockholmsbörsen
 Københavns Fondsbørs
Investeringsforeninger
Københavns Fondsbørs
Investeringsforeninger
 Helsingin pörssi
 World Indices
 US Stocks
US 30
Nasdaq 100
US 500
US Stocks
US 30
Nasdaq 100
US 500
 Toronto Stock Exchange
 London Stock Exchange
 Euronext Amsterdam
 Euronext Brussel
 DAX
SDAX
TECDAX
Frankfurt
CDAX
MDAX
Prime Standard
DAX
SDAX
TECDAX
Frankfurt
CDAX
MDAX
Prime Standard
 CAC 40
 Mumbai S.E.
National S.E.
Mumbai S.E.
National S.E.
 Commodities
 Currency
 Cryptocurrency
 Exchange Traded Funds
 Investtech Indices
Overbought RSI
Published in English on 5 November 2015. Norwegian original here >>
Is overbought RSI a sell signal? Or is RSI largely a momentum indicator, which makes high RSI a buy signal? We have studied price development after RSI has reached extreme levels on the stock exchanges in Oslo, Stockholm, Copenhagen and Helsinki. The results are exciting.
RSI - Relative Strength Index
RSI is a commonly used indicator in technical analysis. RSI means Relative Strength Index, and it measures how well a stock has performed in relation to its own price history. The figure is calculated by measuring the strength of positive days vs. the strength of negative days over a specific period of time, and it gets a value between 0 and 100.
A stock which has risen a lot compared to reactions back during the time period has high RSI. Similarly, a stock which has fallen a lot compared to reactions upwards during the time period has low RSI. RSI is used both as an indicator of whether a stock is overbought or oversold, and whether it has positive or negative momentum.
How can a stocks RSI value predict future price development? Will a stock that has risen a lot, and reached a high RSI value, most likely keep rising or will it react back? Will a stock with low RSI, which indicates it is oversold and has negative momentum, see a reversal upwards or continue falling?
RSI as overbought/oversold indicator
A stock is overbought when it has risen a lot in a short time, without any significant reactions back during the time period. The idea is that it has risen too much and will have a reaction back soon, indicating that it is time to sell the stock. Similarly a stock is oversold when it has fallen a lot in a short time. This may indicate that it will have a reaction up soon and should be bought before then. See example below.
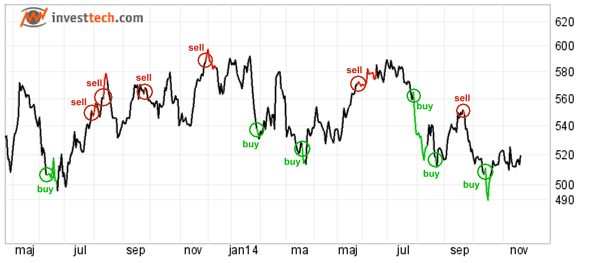
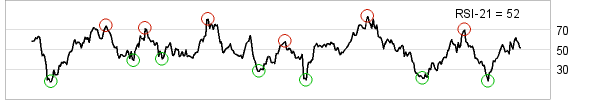
Figure 1: RSI21 in Carlsberg B. Green areas show oversold RSI (below 30) and red areas overbought RSI (above 70).
RSI as momentum indicator
RSI is also used as a momentum indicator. The idea is that major price movements indicate that the investors as a group are in motion. It is thought necessary to join the early movements, as even more investors will join later and drive the price further in the same direction. See example below.
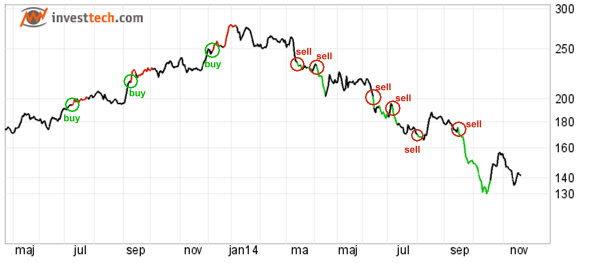
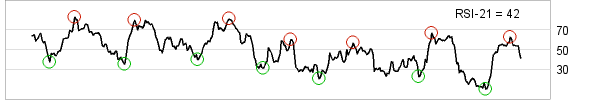
Figure 2: RSI21 in D/S Norden. Red areas show high momentum and positive (RSI above 70) and green areas show high momentum and negative (RSI below 30).
Research into RSI
Investtech has started a research project looking to determine to which degree RSI can be used to predict future price development. The project is part of a bigger signal analysis project, and is supported by the Research Council of Norway.
Is RSI primarily an overbought/oversold indicator or is it a momentum indicator?
We have studied the stocks in the Nordic markets Norway, Sweden, Denmark and Finland.
For Norway we have high quality data from 1996 to 2014, see data description here.
For Sweden we have high quality data from 2003 to 2014, see data description here.
For Denmark and Finland we have data from 2003 to 2014. As is the case for Norway and Sweden, all stocks listed in the period are included, and prices are adjusted for dividend, splits and other corporate actions. However, as we do not have the same daily monitoring, manual checks and data corrections for these markets as for Norway and Sweden, the data quality is not as high.
RSI21 to critical level
We have studied what happens when RSI breaks below 30 and above 70. According to technical analysis literature these are considered critical levels, and are often used as buy and sell signals.
When RSI broke below the 30 limit, a buy signal was triggered based on the oversold strategy. When RSI broke above 70, a sell signal was triggered based on the overbought strategy.
| Number of signals | Norway | Sweden | Denmark | Finland | Total |
| Sell signal RSI21 breaks above 70 | 7,572 | 10,955 | 3,774 | 1,909 | 24,210 |
| Buy signal RSI21 breaks below 30 | 5,309 | 6,945 | 2,217 | 1,037 | 15,508 |
The table shows number of buy and sell signals based on an overbought/oversold RSI21 strategy. Investtechs computers identified a total of 15,508 cases where RSI21 broke below the 30 limit. This is a buy signal based on the oversold strategy. Our computers also identified 24,210 cases where RSI21 broke above the 70 limit, triggering a sell signal in the overbought strategy.
The signals were identified by studying all cases where RSI crossed the critical levels. Only signals where it was more than 14 days since the previous signal in the same stock were counted, in order to avoid near-doubles. Yet a big number of signals will be quite similar, because quite a few stocks follow each other closely in terms of prices. Especially when the exchange has risen or fallen a lot in a short time, many stocks will trigger signals at the same time. The signals (samples) will therefore not be independent, and statistical measures for uncertainty (standard deviation) cannot be used indiscriminately.
Rsi21 Norway.
Rsi21 Sweden.
Rsi21 Denmark.
Rsi21 Finland.
Figure 3: Price development following overbought and oversold signals from RSI21 identified by Investtechs computers. Click the charts for bigger versions.
The charts show average price development following buy and sell signals from RSI21 used as an oversold (buy signal) and overbought (sell signal) indicator. The signals are triggered on day 0. Only days when the exchange is open are included, so 66 days equal approximately three months. Buy signals are the blue line and sell signals are the red one. The shaded areas are the standard deviation of the calculations. Benchmark index is the black line.
| Average return after 66 days | Norway | Sweden | Denmark | Finland | Weighted average |
| Sell signal RSI21 breaks above 70 | 7.3% | 5.8% | 6.1% | 4,8% | 6.2% |
| Buy signal RSI21 breaks below 30 | -0.7% | 1.3% | -0.5% | 1,0% | 0.3% |
| Benchmark | 3.2% | 4.0% | 3.6% | 1.5% | 3.5% |
The results are quite similar in all four markets. Stocks with sell signal, i.e. those that have risen a lot and have overbought RSI, continue to rise. During the 3 months following RSI21 breaking above 70, these stocks have on average risen by 6.3 %. Compare benchmark indices that have risen 3.5 % in an average 66 day period.
Stocks with buy signals, that had fallen a lot in a short time, making RSI21 break below 30, have moved sideways in the next 3 months, with an average rise of 0.2 per cent.
Figure 4: Price development at RSI21 signals in Norway. Same as figure 3, but including price development in the days before the signal was triggered.
Figure 3 clearly shows that stocks that have risen on average continue to rise, and that stocks than have fallen continue their weak performance.
These results may be surprising to many investors. The charts indicate that RSI should be used as a momentum indicator and not as an oversold/overbought indicator.
Sensitivity analysis
A sensitivity analysis indicates how robust the RSI indicator is as an investment tool. We want to vary the parameters of the formulas to study result variation.
We have conducted a sensitivity analysis for the Norwegian market on RSI length (for example 14, 21, 30 days), trigger value (for example signal at RSI above 60, 70, 80) and how the signals are identified (signal at break to extreme levels or when RSI comes back from extreme levels).
The combined results show that the RSI indicator is robust in terms of RSI length, trigger value and signal identification.
We have conducted a sensitivity analysis on the Swedish data as well. The results are similar to the Norwegian ones and strengthen the result significance.
Summary
We have studied 24,210 cases where RSI21 crossed above the 70 limit and 15,508 cases where RSI21 crossed below the 30 limit. We have used 19 years of stock exchange data from Norway and 12 years from the other countries. The data are made up of about 30 % from Norway, 45 % from Sweden, 15 % from Denmark and 10 % from Finland.
The results are consistent in the four markets and show that stocks with high RSI, above the critical 70 limit, keep rising next few months. Stocks with low RSI, below the critical 30 limit, continue to underperform compared to index.
The results are the complete opposite of common RSI usage, where a stock that has risen a lot is sold, based on the idea that it is overbought and will have a reaction back. The results indicate that RSI is well suited as a momentum indicator by identifying stocks with high momentum, and that buying these stocks will give a statistical return significantly above average index return.
Conclusion and possible trading strategy
RSI is considered a good stock picking indicator. A possible strategy may be to buy stocks with high momentum, for example when RSI21 breaks above 70, and hold these for as long as RSI indicates high or neutral momentum. And to sell when RSI falls below, for instance, 50.
Further research intro RSI
We want to check the extent to which extreme price development in single stocks impact the average results. We want to see if there is a difference in the effect of RSI for smaller and bigger companies. It may also be of interest to look into how RSI works combined with other indicators, like support/resistance, volume development and trend.
Extra: RSI formula
      priceUp  = sum(changes(up-days))
      priceDown=-sum(changes(down-days))
      rsi= 100 * priceUp/(priceUp+priceDown)
Keywords: Buy signal,Copenhagen,Helsinki,Momentum,Oslo,Overbought,Oversold,RSI,Sell signal,statistics,Stockholm.
Kirjoittaja

Perustaja ja tutkimustyön johtaja
Investtech
Insight & Skills:
Buy signals from rectangle formations gave 6.2 per cent in three months
"Investtech analysoi markkinoiden psykologiaa ja antaa konkreettisia kaupankäyntisuosituksia päivittäin."

Partner & Senior Advisor - Investtech


Investtech ei takaa analyysien tarkkuutta tai kattavuutta. Kaikkien analyysien tuottamien neuvojen ja signaalien käyttäminen on täysin käyttäjän vastuulla. Investtech ei vastaa mistään tappioista, jotka saattavat syntyä Investtechin analyysien käytön seurauksena. Mahdollisten eturistiriitojen yksityiskohdat mainitaan aina sijoitusneuvon yhteydessä. Lisätietoja Investtechin analyyseistä löytyy täältä disclaimer.
Investtech ei takaa analyysien tarkkuutta tai kattavuutta. Kaikkien analyysien tuottamien neuvojen ja signaalien käyttäminen on täysin käyttäjän vastuulla. Investtech ei vastaa mistään tappioista, jotka saattavat syntyä Investtechin analyysien käytön seurauksena. Mahdollisten eturistiriitojen yksityiskohdat mainitaan aina sijoitusneuvon yhteydessä. Lisätietoja Investtechin analyyseistä löytyy täältä disclaimer.
Päätoimisto
Strandveien 171366 Lysaker, Norway
Tutkimusosasto
Instituttveien 102007 Kjeller, Norway