
 Oslo Børs
 Stockholmsbörsen
 Københavns Fondsbørs
Investeringsforeninger
Københavns Fondsbørs
Investeringsforeninger
 Helsingin pörssi
 World Indices
 US Stocks
US 30
Nasdaq 100
US 500
US Stocks
US 30
Nasdaq 100
US 500
 Toronto Stock Exchange
 London Stock Exchange
 Euronext Amsterdam
 Euronext Brussel
 DAX
SDAX
TECDAX
Frankfurt
CDAX
MDAX
Prime Standard
DAX
SDAX
TECDAX
Frankfurt
CDAX
MDAX
Prime Standard
 CAC 40
 Mumbai S.E.
National S.E.
Mumbai S.E.
National S.E.
 Commodities
 Currency
 Cryptocurrency
 Exchange Traded Funds
 Investtech Indices
Global stocks: Two buy and one sell
Published December 4, 2019
We took a trip to India last week and wrote about a few heavyweights that were driving the Indian stock markets to new highs. We return back to the US markets and will write about three stocks taken from the Stock selection category that Investtech provides. You can filter through some given parameters and get your own customized list of stocks. What we have today is two buy and one sell.
Merck & Co Inc (MRK.US500) Close: 87.38
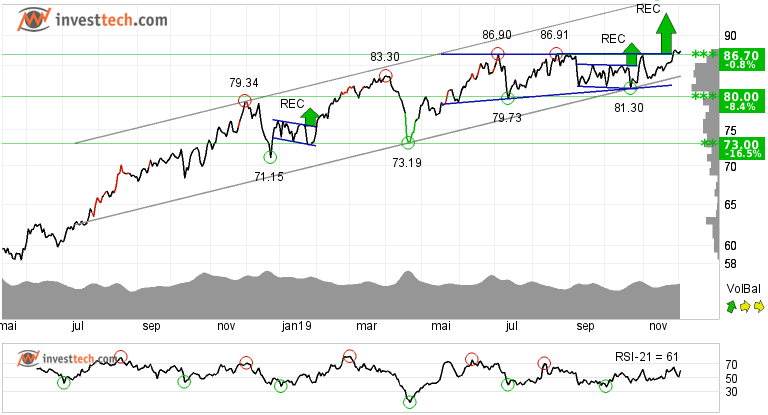
Merck & Co. Inc. is inside a rising trend channel in the medium term. Rising trends show that investors over time have bought the stock at higher prices and indicate good development for the company. Since its bottom in early 2018, the stock has gone up consistently and has gained over 63 per cent.
Merck & Co. Inc. is one of the world's largest pharmaceutical companies and recently the stock gave a positive signal from a rectangle formation at the break up through the resistance at 86.93 dollars. Further rise to 94.03 or more is signalled. The stock has marginally broken up through the resistance at 86.70 dollars. An established break predicts a further rise. There is support around 80 dollars.
The short term momentum indicator RSI is above 70 after a good price increase the past weeks. The short term volume balance indicator is also positive which indicates that more and more investors are now interested in buying the stock. The stock has strong positive momentum and further increase is indicated.
Investtech's outlook (one to six months): Positive
Incyte Corp. (INCY.US500) Close: 94.10
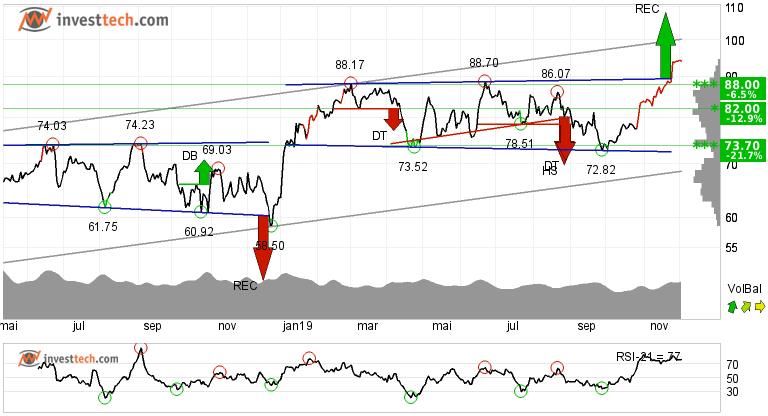
Investors have paid higher prices over time to buy Incyte Corp. and the stock is in a rising trend channel in the short, medium and long term. Rising trends indicate that the company experiences positive development and that buy interest among investors is increasing.
The healthcare and biotech company has recently given a buy signal by closing above the resistance of 88 dollars and has initiated a buy through a breakout from the ceiling of a rectangle formation both in the medium and long term charts. Further rise to 108 dollars or more is indicated. In case of any reaction on the downside, there is support around 88 and 82 dollars respectively.
Positive volume balance shows that volume is higher on days with rising prices than days with falling prices. This indicates increasing optimism among investors. RSI is above 70 after a good price increase the past weeks. The stock has strong positive momentum and further increase is indicated.
Investtech's outlook (one to six months): Positive
IBM (IBM.US500) Close: 132.12
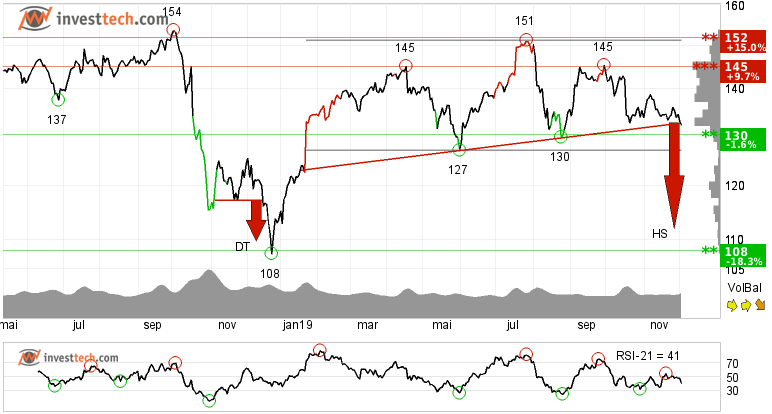
IBM is within an approximate horizontal trend channel in the medium term and is inside a downward trend channel both in the short and long term charts. The stock has marginally closed below the neckline of the head and shoulders formation. An established break below yesterday's close, preferably on higher volume, will initiate a new sell signal.
The stock has some support around 130 dollars, but long term investors seem to be impatient as the volume balance indicator is turning down. Further down the line, next support is around 108 dollars. The stock has resistance around 145 dollars.
Investtech's outlook (one to six months): Negative
The analyses are based on closing price as per December 04, 2019.
These instruments are traded in currency based on the Exchange or country they are listed on.
Kirjoittaja

Analyst
Investtech
"Investtech analysoi markkinoiden psykologiaa ja antaa konkreettisia kaupankäyntisuosituksia päivittäin."

Partner & Senior Advisor - Investtech


Investtech ei takaa analyysien tarkkuutta tai kattavuutta. Kaikkien analyysien tuottamien neuvojen ja signaalien käyttäminen on täysin käyttäjän vastuulla. Investtech ei vastaa mistään tappioista, jotka saattavat syntyä Investtechin analyysien käytön seurauksena. Mahdollisten eturistiriitojen yksityiskohdat mainitaan aina sijoitusneuvon yhteydessä. Lisätietoja Investtechin analyyseistä löytyy täältä disclaimer.
Investtech ei takaa analyysien tarkkuutta tai kattavuutta. Kaikkien analyysien tuottamien neuvojen ja signaalien käyttäminen on täysin käyttäjän vastuulla. Investtech ei vastaa mistään tappioista, jotka saattavat syntyä Investtechin analyysien käytön seurauksena. Mahdollisten eturistiriitojen yksityiskohdat mainitaan aina sijoitusneuvon yhteydessä. Lisätietoja Investtechin analyyseistä löytyy täältä disclaimer.
Päätoimisto
Strandveien 171366 Lysaker, Norway
Tutkimusosasto
Instituttveien 102007 Kjeller, Norway