
 Oslo Børs
 Stockholmsbörsen
 Københavns Fondsbørs
Investeringsforeninger
Københavns Fondsbørs
Investeringsforeninger
 Helsingin pörssi
 World Indices
 US Stocks
US 30
Nasdaq 100
US 500
US Stocks
US 30
Nasdaq 100
US 500
 Toronto Stock Exchange
 London Stock Exchange
 Euronext Amsterdam
 Euronext Brussel
 DAX
SDAX
TECDAX
Frankfurt
CDAX
MDAX
Prime Standard
DAX
SDAX
TECDAX
Frankfurt
CDAX
MDAX
Prime Standard
 CAC 40
 Mumbai S.E.
National S.E.
Mumbai S.E.
National S.E.
 Commodities
 Currency
 Cryptocurrency
 Exchange Traded Funds
 Investtech Indices
Investtech Research: Negative excess return after break downwards from falling trend
Published March 3, 2020
New research from Investtech shows that stocks breaking downwards from medium term falling trends have fallen 2.7 per cent in the following three months. These results largely confirm technical analysis theory, which states that breaks downwards from falling trends increase the fall rate.
Trends are one of the most important elements of technical analysis. They are visual and intuitive and describe in which direction a stock is moving. According to technical analysis theory, stocks in falling trends will continue to fall. A falling trend indicates that the company experiences negative development, that pessimism is spreading among investors and that buy interest is waning.
The trend gives the rising rate of the stock price, and the stock's price target is found by extrapolating trend lines. We distinguish between rising trends, horizontal trends and falling trends. More information on trends and how Investtech identifies different trends can be found here.
Investtech's algorithms identify trend breaks for you. A current example may be Boeing, which has broken downwards from a medium term falling trend per March 2nd.
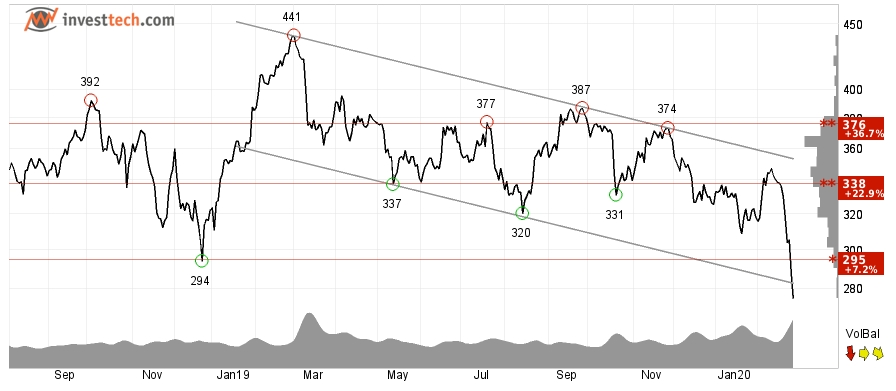
Figure 1: Boeing CO. (The) (BA.US) Close: 275.11 (-12.65), Feb 28, 2020
Our subscribers can find stocks with these negative signals using for instance the tool Trend signals.
We wanted to study the statistical results yielded by sell signals from breaks downwards from falling trends and therefore studied return from Norwegian, Swedish, Danish and Finnish stocks following buy and sell signals from breaks upwards from rising trends and breaks downwards from falling trends identified in Investtechs price charts in the short, medium and long term. We had up to 23 years of data, from 1996 to 2018. We defined a sell signal as the first day a stock entered a falling trend, or when the stock was in a falling trend and it had been more than 22 days since the previous signal.
The chart below shows average price development following sell signals from breaks downwards from falling trends identified in Investtechs medium term price charts in the Nordic markets. The signals are triggered on day 0. Only days when the exchange is open are included, so 66 days equal approximately three months. The thick red line shows the development of sell signal stocks. The shaded areas are the standard deviation of the calculations. The thin red line shows benchmark development in the same period as the sell signal stocks.
Figure 2: Sell signal from break downwards through falling trend, medium term, 1996-2018, the Nordic markets combined.
Stocks breaking downwards from short term falling trends have historically had a weak rise in the first two weeks and moved sideways the rest of the month. They have given an annualised negative excess return of 1.9 percentage points.
Stocks breaking downwards from medium term falling trends fell 2.7 per cent in the next three months. Compared to benchmark in the same period, stocks breaking downwards from falling trends did 2.9 percentage points worse, which equals an annualised negative return of 10.8 percentage points.
Stocks breaking downwards from long term falling trends on average rose 0.4 per cent in three months. This is 1.3 percentage points worse than benchmark and equals a negative excess return of 5.1 percentage points.
The time period for the study is fairly long, the data quality is considered to be good and the algorithms used are entirely automatic. Stocks breaking downwards from medium term falling trends are expected to underperform and statistical measures suggest a high degree of significance.
The analyses also indicate that stocks breaking downwards from short and long term falling trends will underperform, but these results have lower statistical significance. However, it seems that breaks downwards from long term falling trends in individual stocks indicate weak return for the whole market. In addition, there is significant negative excess return three months after breaks downwards from short term falling trends.
Please find more details and results in the research reports here:
Break in trend direction, short term
Break in trend direction, medium term
Break in trend direction, long term
Keywords: h_TFBrD,help topic main report.
Kirjoittaja

Analyst
Investtech
Related articles:
Excess return after break upwards from rising trend
Excess return from stocks in rising trends
Negative excess return from stocks in falling trends
Insight & skills:
"Investtech analysoi markkinoiden psykologiaa ja antaa konkreettisia kaupankäyntisuosituksia päivittäin."

Partner & Senior Advisor - Investtech


Investtech ei takaa analyysien tarkkuutta tai kattavuutta. Kaikkien analyysien tuottamien neuvojen ja signaalien käyttäminen on täysin käyttäjän vastuulla. Investtech ei vastaa mistään tappioista, jotka saattavat syntyä Investtechin analyysien käytön seurauksena. Mahdollisten eturistiriitojen yksityiskohdat mainitaan aina sijoitusneuvon yhteydessä. Lisätietoja Investtechin analyyseistä löytyy täältä disclaimer.
Investtech ei takaa analyysien tarkkuutta tai kattavuutta. Kaikkien analyysien tuottamien neuvojen ja signaalien käyttäminen on täysin käyttäjän vastuulla. Investtech ei vastaa mistään tappioista, jotka saattavat syntyä Investtechin analyysien käytön seurauksena. Mahdollisten eturistiriitojen yksityiskohdat mainitaan aina sijoitusneuvon yhteydessä. Lisätietoja Investtechin analyyseistä löytyy täältä disclaimer.
Päätoimisto
Strandveien 171366 Lysaker, Norway
Tutkimusosasto
Instituttveien 102007 Kjeller, Norway