
 Oslo Børs
 Stockholmsbörsen
 Københavns Fondsbørs
Investeringsforeninger
Københavns Fondsbørs
Investeringsforeninger
 Helsingin pörssi
 World Indices
 US Stocks
US 30
Nasdaq 100
US 500
US Stocks
US 30
Nasdaq 100
US 500
 Toronto Stock Exchange
 London Stock Exchange
 Euronext Amsterdam
 Euronext Brussel
 DAX
SDAX
TECDAX
Frankfurt
CDAX
MDAX
Prime Standard
DAX
SDAX
TECDAX
Frankfurt
CDAX
MDAX
Prime Standard
 CAC 40
 Mumbai S.E.
National S.E.
Mumbai S.E.
National S.E.
 Commodities
 Currency
 Cryptocurrency
 Exchange Traded Funds
 Investtech Indices
Statistics on long term rectangle formations on the Stockholm Stock Exchange 2003-2014
Published 22 February 2017
A study from Investtech based on 11 years of data from the Stockholm Stock Exchange in Sweden shows that stocks with long term buy signals from rectangle formations on average have increased by 5.9 % the following three months. Stocks with sell signals from long term rectangle formations have on average fallen by 3.3 %.
Identification of geometric price patterns in stock prices is an important area of technical analysis. The idea is that these patterns describe the investors mental state, i.e. whether they will want to sell or buy stocks in the time ahead, and they thereby indicate the future direction of the stock price. Rectangle formations are one type of such patterns.
The development of a rectangle formation indicates that the investors are unsure about the future direction of the stock. The price moves sideways between a support level and a resistance level.

Figure 1: Buy signal from rectangle formation.

Figure 2: Sell signal from rectangle formation.
In technical analysis terminology we say that a break upwards triggers a buy signal. Similarly a break downwards from a rectangle formation triggers a sell signal.
Geir Linløkken, Head of Research and Analysis at Investtech, has studied the development of the stock price following buy and sell signals from long term rectangle formations on the Stockholm Stock Exchange in a period of 11 years from 2003 to 2104.
Investtechs computers identified 361 buy signals and 185 sell signals in this period.
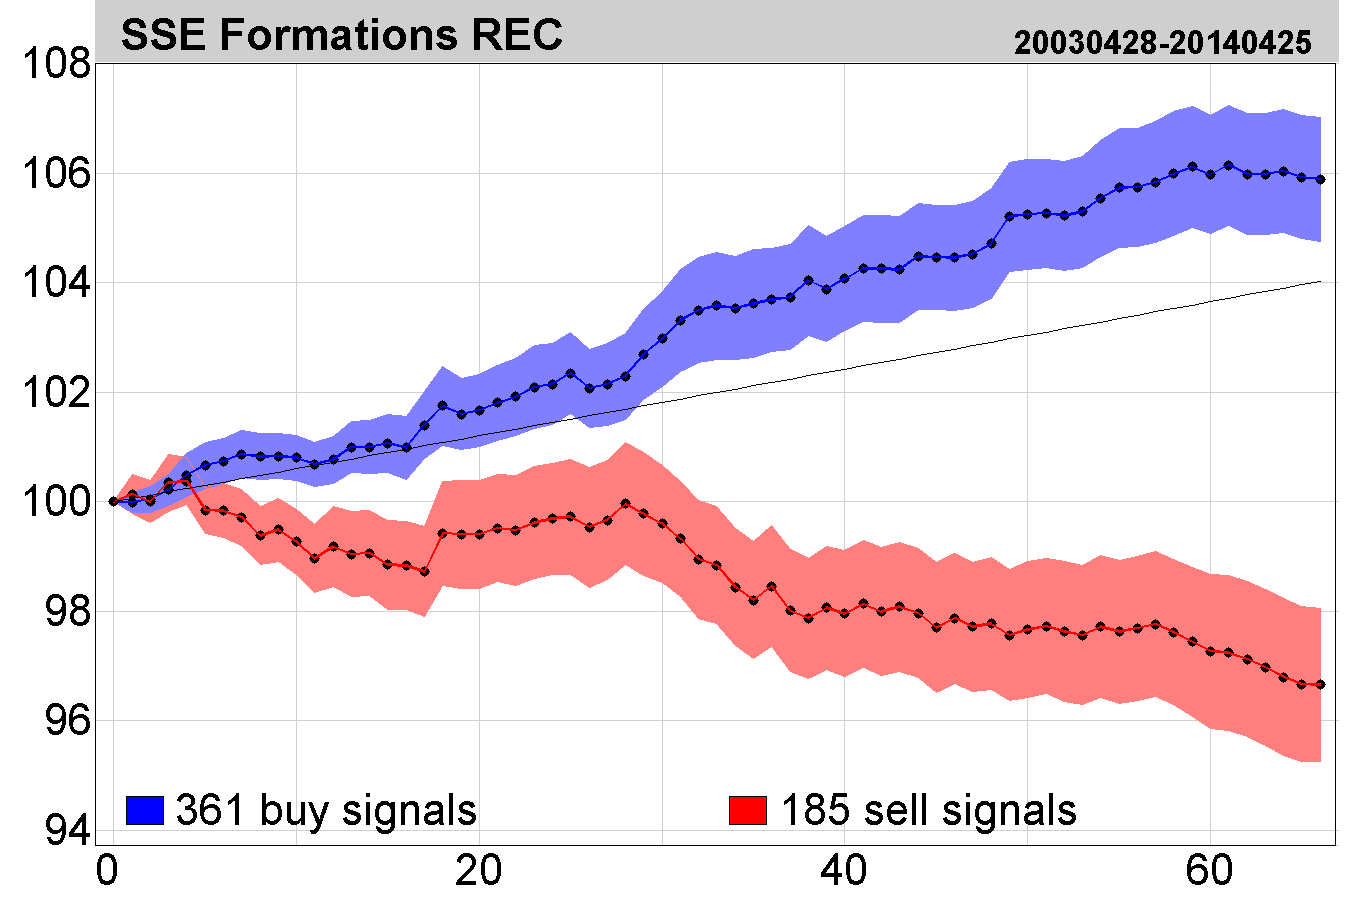
Figure 3: Price development following buy and sell signals from rectangle formations on the Stockholm Stock Exchange identified by Investtechs automatic algorithms in long term charts. Click the image for bigger version.
The chart shows average price development following buy and sell signals from rectangle formations. The signals are triggered on day 0. Only days when the exchange is open are included, so 66 days equal approximately three months. Buy signals are the blue line and sell signals are the red one. The shaded areas are the standard deviation of the calculations. Benchmark index is the black line.
Stocks with buy signals on average increased by 5.9 per cent after three months. Stocks with sell signals on average fell by 3.3 per cent.
We have relatively few observations, which makes the calculations uncertain. Results from the Oslo Stock Exchange do point in the same direction, however, and indicate that signals from long term rectangle formations can be used for decision support when picking stocks, assuming an investment perspective of 3 to 12 months.
Read the complete research report for the Stockholm Stock Exchange here (in Swedish).
Keywords: Buy signal,long term,rectangle formations,Sell signal,statistics,Stockholm Stock Exchange.
Kirjoittaja

Perustaja ja tutkimustyön johtaja
Investtech
"Investtech analysoi markkinoiden psykologiaa ja antaa konkreettisia kaupankäyntisuosituksia päivittäin."

Partner & Senior Advisor - Investtech


Investtech ei takaa analyysien tarkkuutta tai kattavuutta. Kaikkien analyysien tuottamien neuvojen ja signaalien käyttäminen on täysin käyttäjän vastuulla. Investtech ei vastaa mistään tappioista, jotka saattavat syntyä Investtechin analyysien käytön seurauksena. Mahdollisten eturistiriitojen yksityiskohdat mainitaan aina sijoitusneuvon yhteydessä. Lisätietoja Investtechin analyyseistä löytyy täältä disclaimer.
Investtech ei takaa analyysien tarkkuutta tai kattavuutta. Kaikkien analyysien tuottamien neuvojen ja signaalien käyttäminen on täysin käyttäjän vastuulla. Investtech ei vastaa mistään tappioista, jotka saattavat syntyä Investtechin analyysien käytön seurauksena. Mahdollisten eturistiriitojen yksityiskohdat mainitaan aina sijoitusneuvon yhteydessä. Lisätietoja Investtechin analyyseistä löytyy täältä disclaimer.
Päätoimisto
Strandveien 171366 Lysaker, Norway
Tutkimusosasto
Instituttveien 102007 Kjeller, Norway