
 Oslo Børs
 Stockholmsbörsen
 Københavns Fondsbørs
Investeringsforeninger
Københavns Fondsbørs
Investeringsforeninger
 Helsingin pörssi
 World Indices
 US Stocks
US 30
Nasdaq 100
US 500
US Stocks
US 30
Nasdaq 100
US 500
 Toronto Stock Exchange
 London Stock Exchange
 Euronext Amsterdam
 Euronext Brussel
 DAX
SDAX
TECDAX
Frankfurt
CDAX
MDAX
Prime Standard
DAX
SDAX
TECDAX
Frankfurt
CDAX
MDAX
Prime Standard
 CAC 40
 Mumbai S.E.
National S.E.
Mumbai S.E.
National S.E.
 Commodities
 Currency
 Cryptocurrency
 Exchange Traded Funds
 Investtech Indices
Get started
When to buy?
Investtechs analyses help you decide when to buy a stock. Investtechs charts analyse the psychological fluctuations in the market. When optimism increases, it is reflected in the charts. Below are some classic situations with technically positive stocks. Look for similar signals in the charts to find the stocks you should buy.
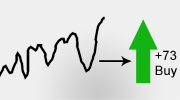
Rising trend and price near trend floor
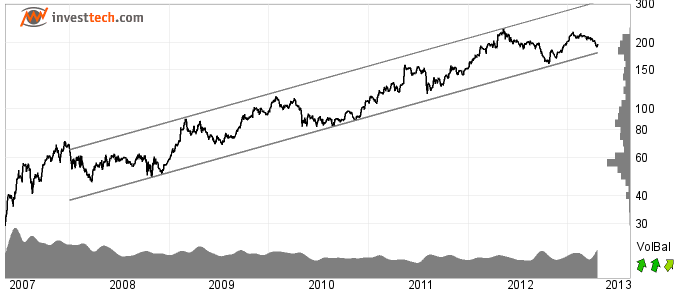
- Buy stocks in rising trends. See the research report on trend signals!
- Buying near the floor of the trend channels gives the greatest upside.
- Positive volume balance (VolBal) confirms the rising trend.
Break up from price formation
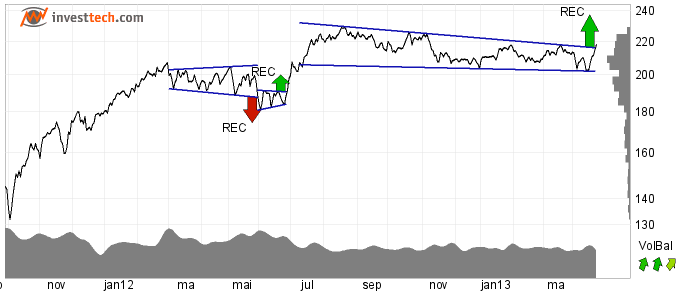
- Buy stocks that trigger buy signals from price formations.
- Two out of three stocks with buy signals from rectangle patterns reach target price. See the research report on buy signals from rectangle formations.
- Positive volume balance confirms breaks upward from price formations.
Near support
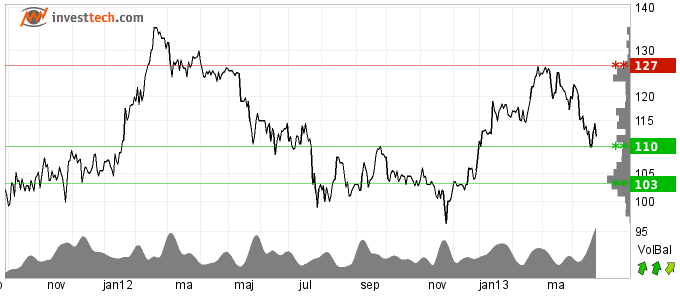
- Buy stocks that have fallen back towards support, in the case of stocks moving sideways or in a rising trend.
- Positive volume balance is a sign of strength.
- Be careful buying near support in falling markets or when volume balance is negative.
When to sell?
Investtechs analyses help you decide when to sell a stock. Investtechs charts analyse the psychological fluctuations in the market. When pessimism increases, it is reflected in the charts. Below are some classic situations with technically negative stocks. Do not buy such stocks! Look out for similar situations in stocks you own.
Falling trend
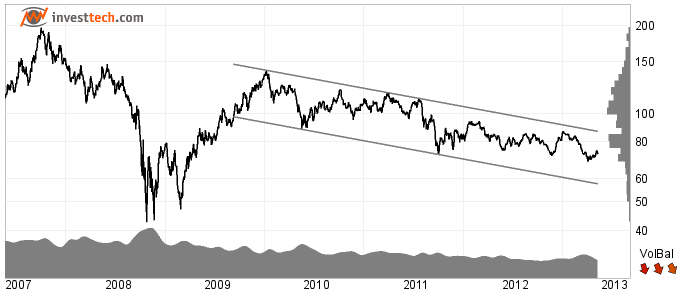
- Sell stocks in falling trends. Stocks in falling trends statistically fall over time and develop worse than the stock exchange. See the research report on trend signals.
- If a stock you own enters a falling trend, sell it!
- Negative volume balance (VolBal) confirms the falling trend.
Break down from price formation
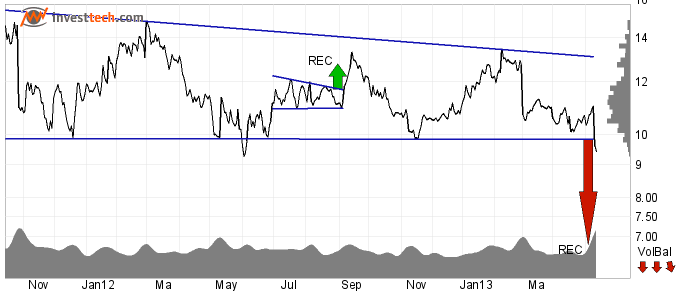
- Sell stocks that have triggered sell signals from price formations.
- Breaks downward from price formations signal that investors optimism is changing into pessimism.
- Negative volume balance confirms breaks downward from formations. Rising volume strengthens the sell signals.
Break down through support
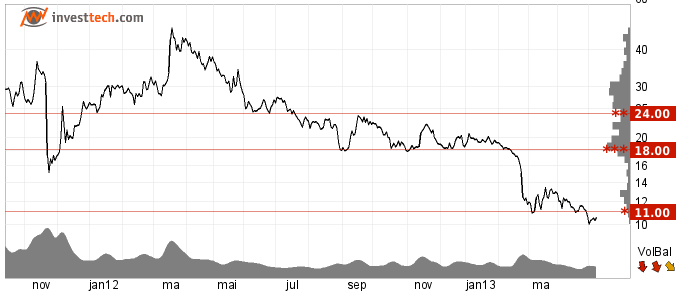
- Sell stocks that have broken downwards through support.
- Breaks through support signal more pessimistic investors.
- Negative volume balance confirms breaks through support. Rising volume strengthens the signal.
How to find buy candidates?
Investtech helps you find buy candidates. Below are some of Investtechs most popular stock picking tools. Clicking on the images gives subscribers direct access to these tools.
 |
Top50
|
 |
Todays Case
|
 |
Trading opportunities
|
How to analyse the stock exchange?
Investtech helps you analyse the stock exchange. Below are some of Investtechs tools for analysing the market.
The procedure is:
- Analyse the market index
- Analyse the hausse index and level of optimism on the exchange
 |
The market index
|
 |
Investtechs optimism index
|
Worth knowing about Investtechs analyses
Investor psychology
We can interpret which psychological changes the investors have been through based on stock price fluctuations and trading volume. We can interpret what they are thinking now, or what mood they are in. This allows us to predict what they will probably do tomorrow or next month.
Trading today will then allow us to enter a stock before many other investors decide to buy, or to exit a stock before many other investors decide to sell.
Investtechs analyses aim to interpret the fluctuations of investor psychology and market tends in order to predict the future development of stock prices. We do this using powerful computers, a large database of historical observations and the theory of technical analysis and behavioural finance.
Automatic analyses
Investtech's automatic analyses are based on advanced methods within pattern recognition, statistics and mathematics, developed since 1993. Emphasis is especially placed upon trends, support and resistance, stock price formations and volume.
For each stock and for each time perspective, a chart is produced together with its associated analysis. By using traditional theory for technical analysis, see Technical Analysis - For reduced risks and increased returns, the computers interpret what they find in the chart and then create both the analyses, texts and the correct recommendations, entirely automatically. This leaves no room for subjective interpretation, which is a common problem with traditional technical analysis, where the analysts draw the trend, support and resistance lines, and then interpret them.
The recommendations from the automatic analyses are given as Positive Candidate, Weak Positive Candidate, Wait/Watch, Weak Negative Candidate and Negative Candidate. Some places, however, Technical score is used. Risk is also indicated.
The analyses are produced and published as soon as possible after the closing of the exchange, and no later than before the exchange's opening the following day.
Time Perspectives
Investtech has three time perspectives for our analysis charts and recommendations.
| Time Perspective | Chart | Investment Perspective |
| Short term | 5 months | 1-6 weeks |
| Medium term | 18 months | 1-6 months |
| Long term | 6 years | 1-6 quarters |
Investtech also provides Candlestick charts covering 21 days. This, combined with short and medium term analysis charts, we consider best suited for investments with 0-10 days perspective.
Investtech guarantees neither the entirety nor accuracy of the analyses. Any consequent exposure related to the advice / signals which emerge in the analyses is completely and entirely at the investors own expense and risk. Investtech is not responsible for any loss, either directly or indirectly, which arises as a result of the use of Investtechs analyses. Details of any arising conflicts of interest will always appear in the investment recommendations. Further information about Investtechs analyses can be found here disclaimer.
The content provided by Investtech.com is NOT SEC or FSA regulated and is therefore not intended for US or UK consumers.
Copyright Ⓒ 1997-2024 Investtech.com AS, Org nr 978 655 424 MVA Privacy Policy | Conditions générales d'utilisation et avis de précaution
Head office
Strandveien 171366 Lysaker, Norway
Research department
Instituttveien 102007 Kjeller, Norway