
 Oslo Børs
 Stockholmsbörsen
 Københavns Fondsbørs
Investeringsforeninger
Københavns Fondsbørs
Investeringsforeninger
 Helsingin pörssi
 World Indices
 US Stocks
US 30
Nasdaq 100
US 500
US Stocks
US 30
Nasdaq 100
US 500
 Toronto Stock Exchange
 London Stock Exchange
 Euronext Amsterdam
 Euronext Brussel
 DAX
SDAX
TECDAX
Frankfurt
CDAX
MDAX
Prime Standard
DAX
SDAX
TECDAX
Frankfurt
CDAX
MDAX
Prime Standard
 CAC 40
 Mumbai S.E.
National S.E.
Mumbai S.E.
National S.E.
 Commodities
 Currency
 Cryptocurrency
 Exchange Traded Funds
 Investtech Indices
Return following signals from long term double bottom and double top formations on the Oslo Stock Exchange 1996-2014
Research results from Investtech, 6 February 2015
Published in English on 13 February 2015. Norwegian original here >>
About the author
Geir Linløkken is the Head of Analysis and Research at Investtech, and is responsible for portfolios and money management. He founded Investtech in 1997, to provide independent technical analyses based on science and investor psychology. Mr. Linløkken has an MSc. in Computer Science, specializing in Mathematical Modeling, at the University of Oslo. He is the author of the book Technical Stock Analysis. His daily work includes analysing stocks and developing quantitative methods for stock market investments.
Keywords: double top formation, double bottom formation, buy signal, sell signal, Oslo stock exchange, technical analysis, statistics
Abstract:
Geometric price patterns, like double bottom and double top formations, are used in technical analysis to predict future price development. Many investors use this as an important part of their decision making process when buying or selling stocks. We have looked at the price movements that followed signals from these formations on the Oslo Stock Exchange in a period of 19 years, from 1996 to 2014. Stocks with buy signals have on average increased by 11.3 % after three months, while stocks with sell signals have fallen 1.1 %. Compared to average stock exchange development in the same period, buy signals did 8.1 percentage points better and sell signals did 4.3 percentage points worse.
Research into technical price formations
This research report is part of a bigger research project conducted by Investtech into price development following technical formations in stock prices. This report is on long term double bottom and double top formations on the Oslo Stock Exchange in Norway.
| Short term | Medium term | Long term | |
| Rectangle | Report | Report | Report |
| Inverse/ head and shoulders | Report | Report | Report |
| Double top, double bottom | Report | Report | Present |
We have already studied signals from long term head and shoulders formations and inverse head and shoulders formations on the Oslo and Stockholm Stock Exchanges. We found good price increases following buy signals and falling or sideway prices following sell signals. However, we had fairly few observations and the combined results were not very significant. Therefore we wanted to look at more technical indicators that signal long term trend reversals, which is an important motivator for this report.
Double bottom and double top formations
Identification of geometric price patterns in stock prices is an important area of technical analysis. The idea is that these patterns describe the investors mental state, i.e. whether they will want to sell or buy stocks in the time ahead, and they thereby indicate the future direction of the stock price. Double top and double bottom formations are two kinds of such patterns.
A double top formation is a top formation which marks the end of a rising period. The formation consists of two tops of approximately the same width and height, see figure 1. The formation of a double top mirrors increasing pessimism among investors and signals the beginning of a falling trend. Double top formations are especially useful in predicting long term market trend reversals, but are also used in the shorter term.
There is an opposite version of this formation; the double bottom formation, see figure 2. This is a bottom formation which marks the end of a falling period. A double bottom formation signals increasing optimism among investors and the start of a rising trend.

Figure 1: Sell signal from double top formation.

Figure 2: Buy signal from double bottom formation.
In technical analysis terminology, a break down from a double top formation triggers a sell signal. Similarly a break upwards from a double bottom formation triggers a buy signal. We have studied the price movements following buy and sell signals from such formations on the Oslo Stock Exchange in Norway.
Identification
It is no easy task to identify double top formations in stock prices. The illustrations above show that the price forms two even tops of approximately the same size, before it breaks downwards and triggers a signal. However, stock prices are rarely as regular as these illustrations. The price will often be quite uneven and the tops will be of differing width or height.
Many investors identify price patterns by looking at price charts and drawing lines by hand. This method has many weaknesses, most of all that it is subjective, allowing you to see the formations you want to see, and it is very time consuming. Therefore we need an automatic algorithm whereby computers identify the formations and the signals they trigger.
Investtech has studied technical and quantitative analysis since 1997. We have developed mathematical algorithms for automatic identification of double top and double bottom formations in stock prices. The formations are entered into the technical analysis charts, shows in signal lists and presented updated daily to Investtechs subscribers.
In this report we have looked at the price movements that follow buy and sell signals from double bottom and double top formations on the Oslo Stock Exchange. The statistics are based on formations automatically recognized by Investtechs computer programs. No parameter optimization or changes to algorithms have been made during this study. This is an analysis based on the existing historical material.
The Base Data
We have used stock prices from 1 January 1996 to 10 October 2014 as the basis for the statistics. In this period, the main index on the Oslo Exchange rose from 106.9 to 573.6 points, which is 437 % or approximately 9.3 % a year. Compared to the risk free interest rate in this period, this is approximately what can be expected for similar periods of time.
In eight of these 19 years, the exchange rose by over 30 %, while it fell by more than 10 % in five of the years, and varied between minus 10 % to plus 30 % in five of the years. We have had both good and bad periods, and several sideways periods as well, and consider this representative for a normal period of time on the exchange.
All stocks that have been listed in the period are included. Stocks that have been delisted due to for instance mergers, takeovers and bankruptcy are included. However, we only have data for these companies for as long as they were listed. A company which went bankrupt will then have a final trading price which is not zero, which is a weakness in this study. However, this is only the case for a small number of companies. Most companies also fall a lot before they are delisted, so the difference between the price fall from when they were listed and a price fall down to zero will be small.
It is also very rare that new buy signals are generated from double bottom formations when a companys stock price is falling. Therefore it matters very little to the statistics for buy signals. Return from sell signals would however have been a little weaker had we corrected for bankruptcies. Combined it is our opinion that these conditions have minimal impact on the results of this study.
All prices are adjusted for splits, dividend payments, reverse splits, and other corporate capital changes, in order to reflect the actual value development of the stocks.
715 time series are included, of which 597 are stocks with at least 66 days of trading. At the end of the period, approximately 220 stocks were listed on the exchange.
The stocks daily closing price is used. We have only used prices and turnover figures from the stocks primary market place. Alternative markets like Chi-X, Bats and Burgundy are excluded.
The Data Set
We have used Investtechs algorithms for automatic identification of price formations. The algorithms were run on long term charts made up of 1,399 price days, approximately 6 calendar years. We consider the algorithms good at identifying actual double top and double bottom formations, and they do not classify indistinct patterns as actual formations.
At identification of signals, only data up to the date the signal was triggered were used. The later data were hidden from the algorithm.
All signals identified from double top and double bottom formations are used. Normally each formation only triggers one signal. However, in rare cases they may trigger several signals. This happens if the price following the break reacts back into the formation, creates a modified formation and then breaks out again.
Sometimes one stock can also trigger several signals on the same day. This happens if the algorithms have recognized several formations of different length and height which are broken out from at the same time.
In order to have the data set as representative for the Oslo Stock Exchange as possible, we remove certain signals from the data set:
- Duplicate signals are removed. This will be the case when there have been mergers and ticker changes, where Investtech has two editions of the same historical time series. For instance, we remove a buy signal from DNB if we already have it for DNBNOR.
- Signals that are very close in time to a previous signal are removed. It is a requirement that there have been at least seven calendar days since the previous signal from the same stock in order for a new signal to be counted.
- Formations that are less than 2 % in height are discarded. These are small and considered to have low signal value.
- Signals from stocks with poor liquidity are discarded. This is because it is difficult for investors to make actual trades in such stocks, and also because the price is often uneven and with big leaps, making pricing uncertain and subject to noise.
We discard signals where daily average turnover on the Oslo Exchange in the past ten days including the signal day was lower than half a million Norwegian krone (NOK) or where the stock was traded on less than half the days. This also removed all signals from the exchange indices, leaving us with signals from stocks and equity certificates only, and a few traded funds. The actual turnover of stocks that gave signals may have been above this limit, as trade in other markets than the Oslo Exchange, like Chi-X, Bats and Burgundy, are not included. - Signals with less than 66 days' price history following the signals are removed. This gives complete price history for the first 66 days following the signals.
Our data set now consists of 153 identified buy signals from double bottom formations and 143 sell signals from double top formations in stocks and equity certificates on the Oslo Stock Exchange in the period 1996 to 2014.
Results
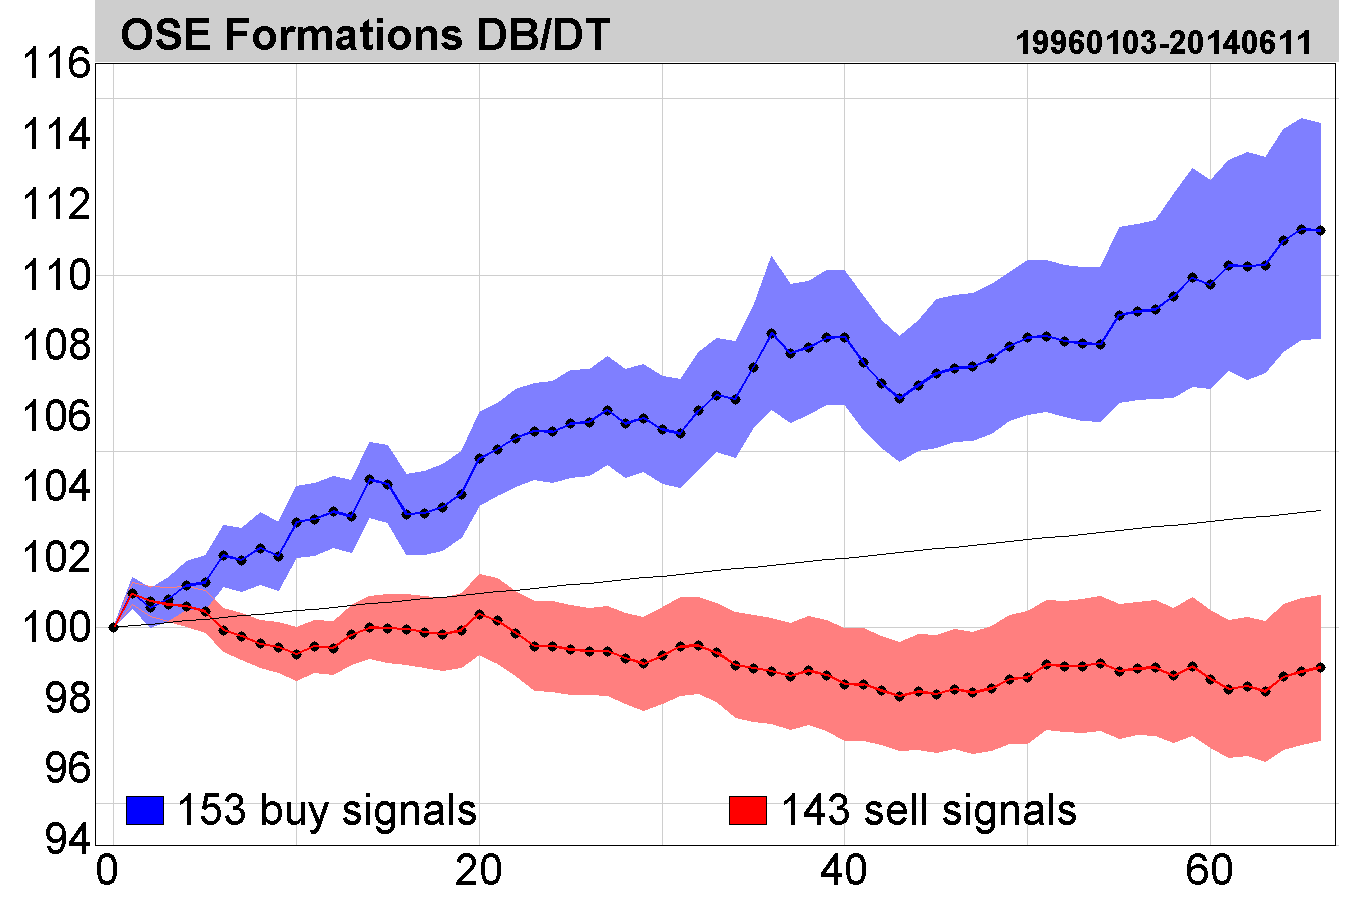
Figure 3: Price development after buy and sell signals from double bottom and double top formations on the Oslo Stock Exchange identified by Investtechs automatic algorithms in long term price charts. Click the image for bigger version.
The chart shows average price development following buy and sell signals from double top and double bottom formations. The signals are triggered on day 0. Only days when the exchange is open are included, so 66 days equal approximately three months. Buy signals are the blue line and sell signals are the red one. The shaded areas are the standard deviation of the calculations. Benchmark index is the black line.
Buy signals
| Buy signal | Day 1 | 10 | 22 | 66 | 250 |
| Absolute | 0.97 % | 2.99 % | 5.37 % | 11.25 % | 28.83 % |
| Benchmark | 0.05 % | 0.48 % | 1.05 % | 3.18 % | 12.61 % |
| Relative, percentage points | 0.93 | 2.52 | 4.32 | 8.07 | 16.22 |
| Statistical T-value | 2.01 | 2.49 | 3.12 | 2.64 | 2.13 |
Buy signals from double bottom formations identified in Investtechs long term charts have historically given increasing prices in the following months. On average, stocks that triggered buy signals have risen 11.3 % in the following three months. This is 8.1 percentage points better than index, which rose 3.2 % in an average 3 month period. The figures are considered moderately significant, with a statistical T-value of 2.6.
The somewhat uneven chart is a result of few observations with great variation from day to day. Apart from this the increase is quite even throughout the period.
The average figures are calculated from 153 observations. This is a low number, and the uncertainty of the calculations is therefore fairly large. The blue shaded area shows the standard deviation of these estimates. Assuming normal distribution and independent observations, the average price development following buy signals from double bottom formations has a 68 % probability of falling within this interval.
There is great variation from signal to signal. A count showed that 66 % of the signals gave return which was positive or zero after 66 days, while 34 % gave negative return. As such there is fairly high probability of losing money from one investment based on one buy signal from one double bottom formation, even though the average is positive.
Sell signals
| Sell signals | Day 1 | 10 | 22 | 66 | 250 |
| Absolute | 0.96 % | -0.76 % | -0.16 % | -1.14 % | 2.24 % |
| Benchmark | 0.05 % | 0.48 % | 1.05 % | 3.18 % | 12.61 % |
| Relative, percentage points | 0.92 | -1.23 | -1.21 | -4.33 | -10.37 |
| Statistical T-value | 3.02 | -1.65 | -1.01 | -2.11 | -2.51 |
Sell signals from double top formations identified in Investtechs long term price charts have historically been followed by a weak price fall in the following months. On average stocks with sell signals have fallen 1.1 % the following three months, equal to 4.3 percentage points weaker than average three month index development.
The average figures are calculated from 143 observations. This is a low number. The figures are considered moderately significant versus the average 66 day benchmark index development, with a statistical T-value of 2.1 standard deviations.
As is the case with buy signals, there is great variation from signal to signal. In total 50 % of the signals gave negative or zero return after 66 days, and 50 % gave positive return.
Robustness against extreme impact from individual stocks
The results are based on average return figures. If any individual stock shows extreme effects, like a rise of several hundred per cent, this may strongly impact the average figures. To investigate this, we have calculated how much each stock weighs in the calculation of the average figures.
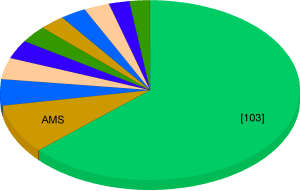
Figure 4: Weight per stock in the calculation of average price development following buy signals. The 10 most highly weighted stocks are indicated in their own sectors of the pie chart.
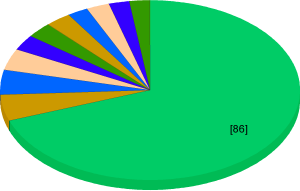
Figure 5: Weight per stock in the calculation of average price development following sell signals.
The charts show each stocks contribution to the average figures on day 66 following the signal. In the case of buy signals, the ten most heavily weighted stocks make up 36 % of the total. American Shipping Company alone makes 9 %, while the other nine are between 2.1 and 4.5 per cent each. The remaining 64 % consists of 103 different stocks. For the sell signals, the most heavily weighted stocks make up 31 % of the total. The remaining 69 % consists of 86 different stocks.
A relatively large part of the average is made up of a small number of stocks. Except for American Shipping Companys 9 per cent, however, no stocks weigh over five per cent. This shows that the results are likely not due to extreme results in one or a few individual stocks. However, we would like a more extensive data set in order to get more robust figures and lower estimator variance.
The importance of liquidity
In the calculations above we have included signals from stocks with an average daily turnover of at least half a million Norwegian krone on the Oslo Stock Exchange at the time the signal was triggered. Varying the liquidity parameters allows us to investigate if there is a difference in signal strength for smaller and bigger companies.
Drawing the line at five million krone splits the companies into two roughly similar groups. Signals from stocks with turnover below five million come to 146 signals, and those with turnover above five million come to 150 signals.
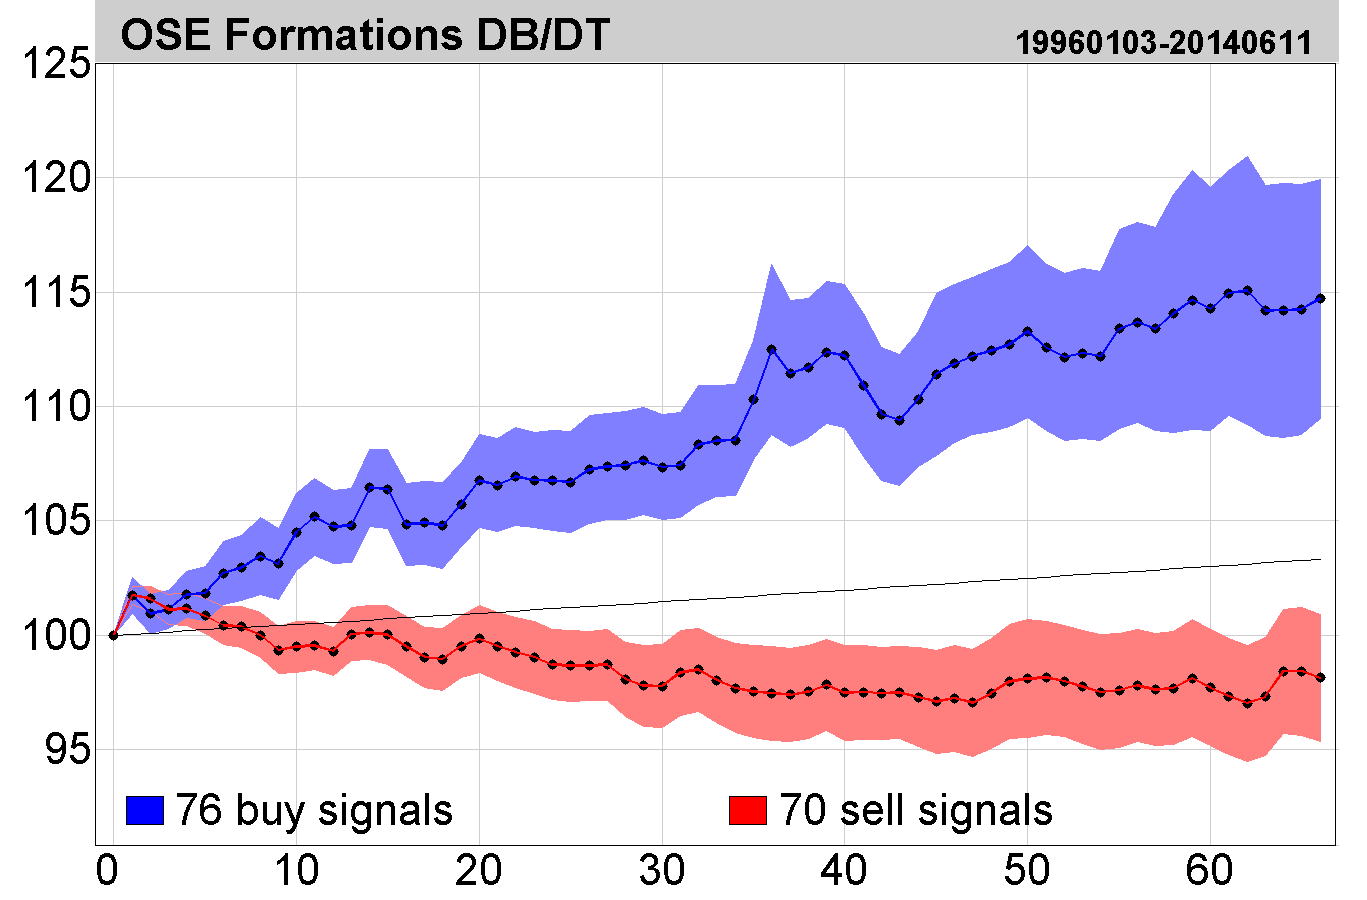
Figure 6: Signals from companies with daily turnover between one half and five million krone.
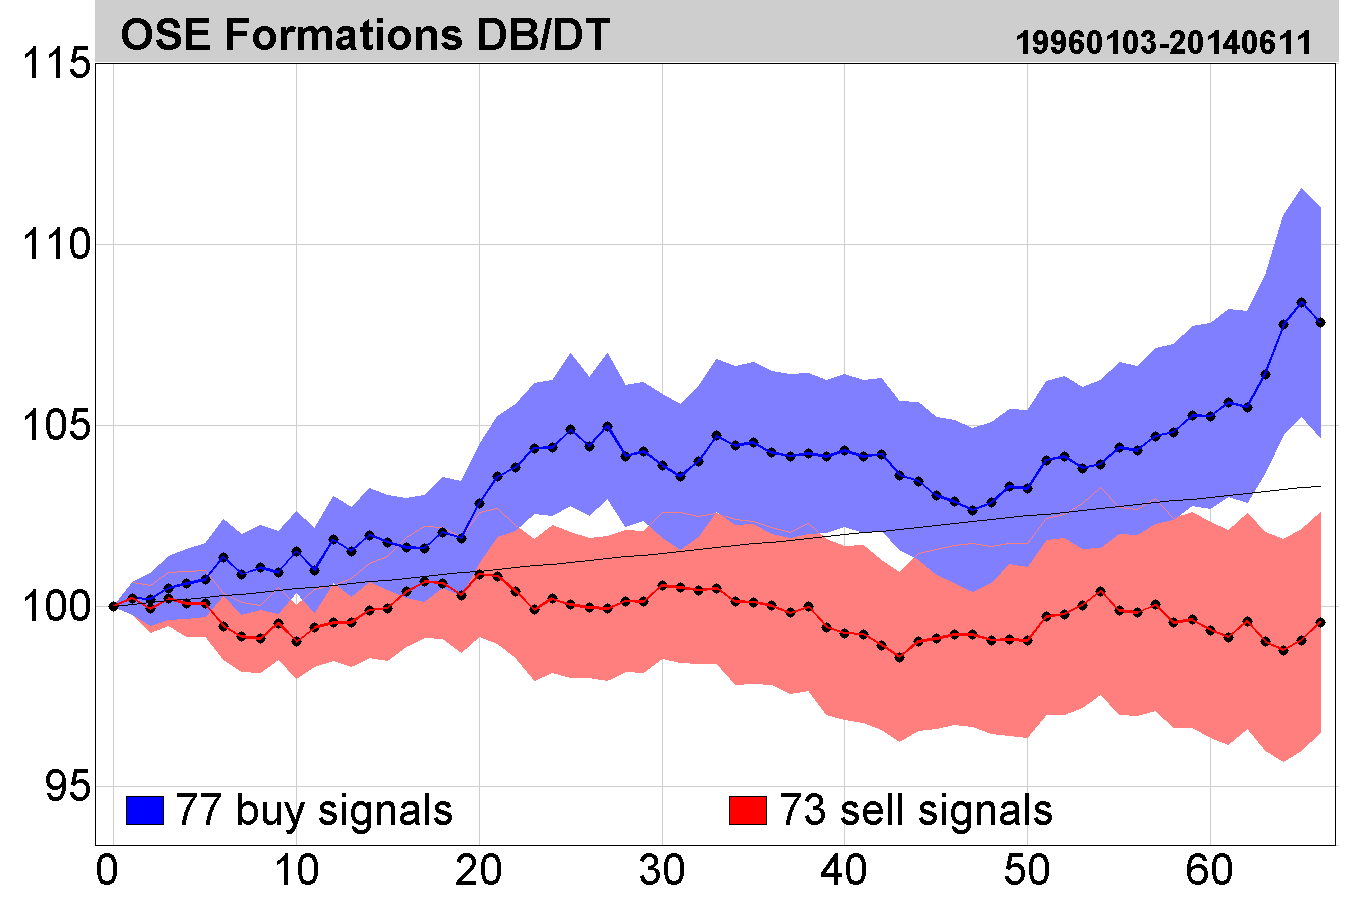
Figure 7: Signals from companies with daily turnover above five million krone.
Figures 6 and 7 show that buy signals on average are followed by a price increase, and sell signals by negative or sideways price development, for both the bigger and smaller companies. However, the signals from the smaller companies have given larger price developments than signals from the bigger companies. This indicates that buy signals from long term double bottom formations and sell signals from long term double top formations have stronger signal power for the smaller companies.
The results are based on a small number of observations, which means that the variance of the estimators, illustrated by the shaded areas, is great. Results from the Swedish Stock Exchange indicate little difference between signal power for the smaller and bigger companies. As such we should not place too much importance on this liquidity analysis.
Long term signal power
The signals in this study are identified in Investtechs long term technical charts. Such charts are often used to analyse the exchange with the price development of the next three to 18 months in mind. It is therefore interesting to look at the price development also in periods beyond 66 days following the signal.
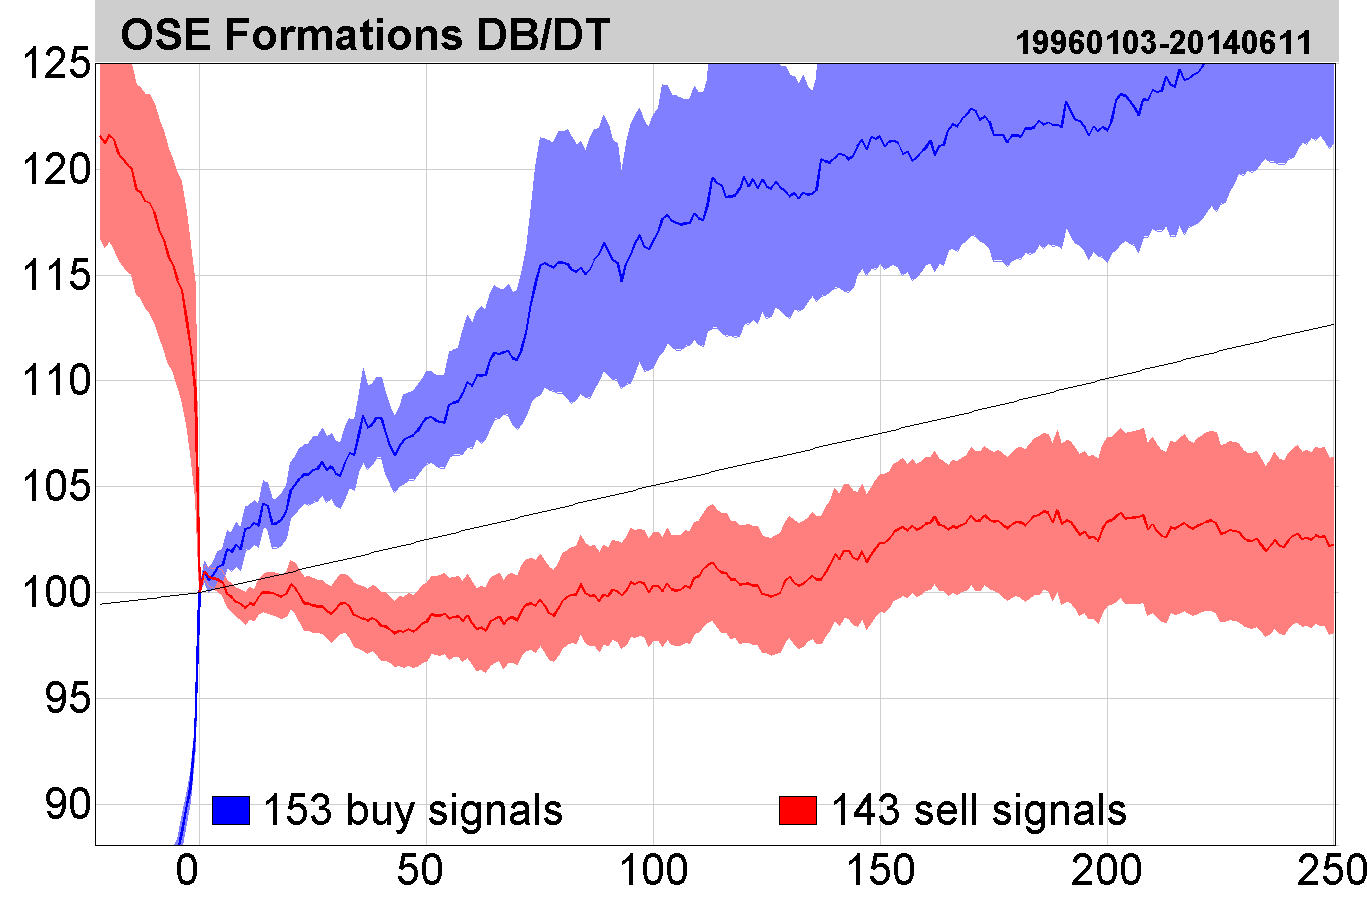
Figure 8: Price development from buy and sell signals from double top and double bottom formations on the Oslo Stock Exchange. The chart shows price development from 22 days before the signals were triggered till 250 days after. Click the image for bigger version.
The chart shows that buy signals from long term double bottom formations on average have been followed by good price increase the whole next year. The rise has been stronger the first four months and has then kept pace with the average stock exchange index.
Stocks with sell signals from long term double top formations have on average had a weak fall the first two months and then moved sideways or with a slow rise for the next ten months which is clearly a weaker development than the average stock exchange index.
We also note that the width of the confidence interval increases drastically. This shows great differences between the signal stocks. The significance of the results for buy signals becomes weaker over time, while it becomes a little stronger for sell signals. The combined indication is that the price formations have predictive power also beyond 66 days after signal.
Price development before signals are triggered
Figure 8 shows price development for 22 days, approximately one month, before the stocks trigger signals. We see the same conditions as we have seen earlier for long term signals from head and shoulders and inverse head and shoulders formations.
The chart shows that stocks with buy signals from double bottom formations on average have risen a lot in the last 22 days up to and including the day the signal was triggered. It can be psychologically difficult to buy a stock which has risen so much in such a short time. This may be part of the reason why the signal works so well. The stock should rise more, based on the news or fundamental conditions that perhaps triggered the signal, but it does not due to investor psychology and human weakness. Over time the investors accept the basis for the price increase and become more positive, which gives a good rise over the next few months.
The same is true for sell signals. The chart shows that stocks with sell signals from double top formations fall a lot in the last 22 days up to and including the day the signal was triggered. Yet they continue to fall or move sideways the next weeks and months. It may be psychologically difficult to sell a stock which has become much cheaper in a short period of time. It takes time for the actual state of affairs to be accepted, fundamental analyses to be adjusted and investors to conquer their own psychological resistance to selling on lower prices. Thus the stocks weak development continues also after the price fall that triggered the signal.
The Stockhom Stock Exchange in Sweden
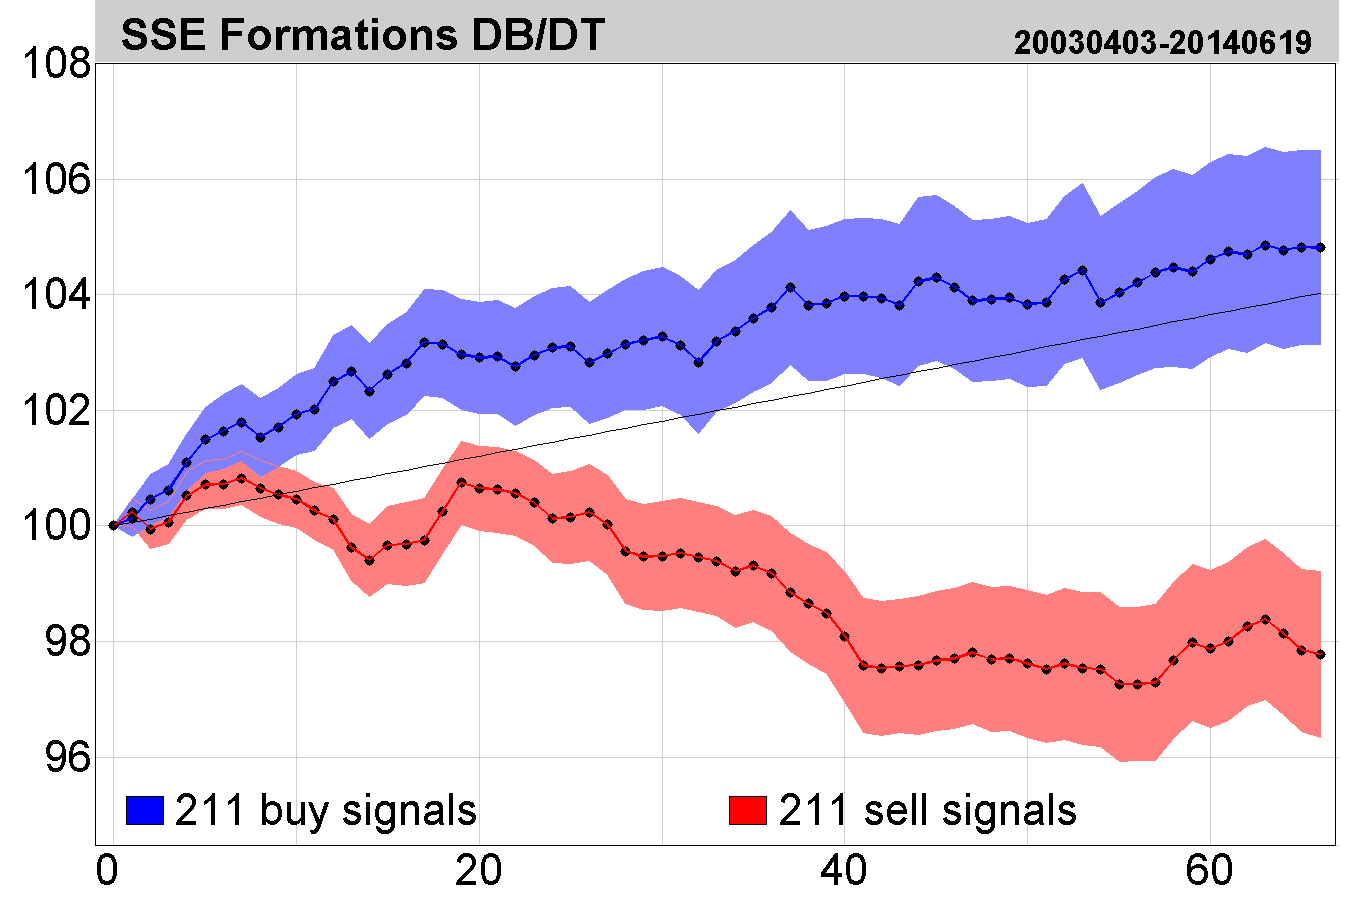
Figure 9. Price development following buy and sell signals from double bottom and double top formations on the Stockholm Stock Exchange.
We have conducted the same study on the Stockholm Stock Exchange in Sweden, for the period 1 April 2003 to 10 October 2014. Investtechs computers identified 213 buy signals and 211 sell signals in this period.
On the Stockholm Exchange, as well, buy signals from double bottom formations were followed by rising prices the next three months, and rose more than the exchange in an average three-month period. Stocks with sell signals from double top formations on average fell in the next three months, showing significantly weaker development than average benchmark index development.
The results for the sell signals are clearer than on the Oslo Stock Exchange, whereas the results for the buy signals are less clear. The data from Sweden do not give reason to say that the signals had better predictive power for smaller or bigger companies.
This indicates a small data set and that further studies are necessary.
Read the complete research report for the Stockholm Stock Exchange here (in Swedish).
Summary, discussion and what next
We have studied return from stocks on the Oslo Stock Exchange with breaks through technical double top and double bottom formations over a period of 19 years, from 1996 to 2014. Investtechs automatic algorithms identified a total of 153 buy signals and 143 sell signals from such formations. The buy signals gave an average return of 11.3 % in the following three months, and sell signals gave a return of -1.1 %. Relative to average benchmark index development, the buy signals gave an excess return of 8.1 percentage points, while the sell signals gave a negative excess return of 4.3 percentage points.
The signals demonstrate strong average results. The time period for the study is fairly long, the quality of the data is considered to be good and the algorithms used are entirely automatic and deemed to identify only actual price formations. Statistical measures suggest a moderate degree of significance, which indicates that we may have found actual connections between signals from price formations and future return, such that trading based on these formations can also give good results in the future.
However, the numbers are based on relatively few observations. Results from Sweden are more significant for sell signals, but less significant for buy signals. It is therefore necessary to conduct further studies. In particular it would be interesting to look at other price formations that are meant to signal the same thing as double top and double bottom formations, i.e. long term trend reversals. It would be especially interesting to compare with results from long term head and shoulders formations and inverse head and shoulders formations, which we have already analysed. It may also be of interest to look at long term rectangle formations. In addition, the medium long term signal power of double top and double bottom formations is of interest, as well as results from these formations in other markets. Longer periods of time would also be preferable, for broader base data with more observations.
Litteratur
- Investtech, Insight & Skills. Price formations. Link
- Investtech, Insight & Skills. Buy signal from double bottom formation. Link
- Investtech, Insight & Skills. Sell signal from double top formation. Link
- Geir Linløkken. Return following signals from double bottom and double top formations - the Stockholm Stock Exchange 2003-2014 . Investtech.com, 2014. Link (in Swedish)
- Geir Linløkken. Return following signals from rectangle formations - the Oslo Stock Exchange 1996-2014. Investtech.com, 2014. Link
- Geir Linløkken. Return following signals from rectangle formations - the Stockholm Stock Exchange 2003-2014. Investtech.com, 2014. Link
- Geir Linløkken. Return following signals from head and shoulders formations - the Oslo Stock Exchange 1996-2014. Investtech.com, 2014. Link
- Geir Linløkken. Return following signals from head and shoulders formations - the Stockholm Stock Exchange 2003-2014. Investtech.com, 2014. Link (in Swedish)
- Geir Linløkken og Steffen Frölich. Technical Stock Analysis - for reduced risk and increased returns. Investtech.com, 2001.
- John J. Murphy. Technical Analysis of the Financial Markets. New York Institute of Finance, 1999.
Keywords: Buy signal,double bottom formation,double top formation,Oslo Stock Exchange,Sell signal,statistics,Technical analysis.
Written by

Head of Research and Analysis
at Investtech
"Investtech analyses the psychology of the market and gives concrete trading suggestions every day."

Partner & Senior Advisor - Investtech


Investtech guarantees neither the entirety nor accuracy of the analyses. Any consequent exposure related to the advice / signals which emerge in the analyses is completely and entirely at the investors own expense and risk. Investtech is not responsible for any loss, either directly or indirectly, which arises as a result of the use of Investtechs analyses. Details of any arising conflicts of interest will always appear in the investment recommendations. Further information about Investtechs analyses can be found here disclaimer.
The content provided by Investtech.com is NOT SEC or FSA regulated and is therefore not intended for US or UK consumers.
Copyright Ⓒ 1997-2024 Investtech.com AS, Org nr 978 655 424 MVA Privacy Policy | Conditions générales d'utilisation et avis de précaution
Head office
Strandveien 171366 Lysaker, Norway
Research department
Instituttveien 102007 Kjeller, Norway