Analysis News

  • Markedets bedste nyhedsbrev
  • Tilpasset dine behov
  • Gratis på e-mail hver dag før børs

Receive Analysis News:

E-mail:

Free daily newsletter every morning

Content
Signaux
Tous les indices - Moyen terme
Danske Bank4. sep 2026
Gubra4. sep 2026
Djurslands Bank4. sep 2026
North Media4. sep 2026
EgnsINVEST Ejendomme T4. sep 2026

The market showed a small loss vendredi, and OMX Copenhagen 25 GI (OMXC25GI) ended the day at 2335 points, which is a decline of 0.2 percent. The week as a whole showed a loss of 0.6%.

60 shares showed a gain and 59 showed a loss. 21 shares were unchanged and closed at the same price as the previous day. There was no trading in 8 shares.

Total value of the trading volume for shares and primary capital certificates vendredi was approximately 5.0 billion.

Schouw & Co. (SCHO) moved up and ended at 784 kroner, which is an increase of 1.7 percent. L'action has thereby closed up 16 out of the past 22 days and this past month l'action has gained as much as 27.5 percent. It also looks good technically. L'action is trend wise positive in the medium term, has support at 690 kroner and a further increase is indicated.
D/S Norden (DNORD) was up 5.4 percent to close at 387 kroner. L'action has not closed higher since avril 2023. L'action has thereby closed up 14 out of the past 18 days and this past month l'action has gained as much as 19.6 percent. Technically it also looks good. L'action is trend wise positive in the medium term, has support at 327 kroner and a further increase is indicated.
TORM A (TRMDA) closed up 3.2 percent to 228 kroner. L'action has now closed up for the seventh day in a row and this past month l'action has gained as much as 20.8 percent. It also looks good technically. L'action is trend wise positive in the medium term, has support at 188 kroner and a further increase is indicated.
A.P. Møller - Mærsk B (MAERSKB) gained 4.6 percent to 22610 kroner. L'action thereby reached a new all time high for the 15. time this year. This past month l'action has gained as much as 34.8 percent. Technically it also looks good. L'action is trend wise positive in the medium term, has support at 18000 kroner and a further increase is indicated.
Novonesis AS (NSISB) closed at 437 kroner after posting a loss of 3.1 percent. L'action has never lost more in one day since juillet 23, when it was down 3.4 percent. Technically, however, it looks good. L'action is trend wise positive in the medium term, has support at 416 kroner and a further increase is indicated.

US 500 weakly lower vendredi
The market showed a small loss vendredi, and S&P 500 (SP500) ended the day at 7719 points, which is a decline of 0.4 percent. For the week as a whole the index showed only a slight change of +0.1%.

Stockholmsbörsen weakly higher vendredi
The market showed a small gain vendredi, and OMX Stockholm PI (OMXSPI) ended the day at 1141 points, which is an increase of 0.2 percent. The week as a whole showed a loss of 1.2%.

Indices
OMX Copenhagen 25 GI
arrow green   Candidat positif intéressant
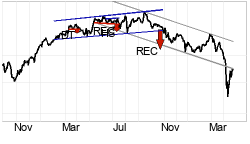
OMX Copenhagen 25 GI progresse fortement dans un canal haussier. Pour la suite, la progression reste bien orientée et il y a du support en bas du canal haussier. L'indice a franchi la résistance à environ 2320 points et une poursuite de la hausse est annoncée. L'indice est considéré comme positif technique pour moyen long terme.
S&P 500
arrow green   Candidat positif intéressant
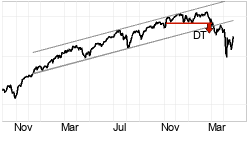
S&P 500 fluctue dans un canal haussier. Un développement positif poursuivant le canal haussier est indiqué. En plus une formation rectangulaire a donné un signal d'achat suite au franchissement à la hausse de la résistance à 7594. Une poursuite de la hausse jusqu'à 7833 ou plus est indiquée. L'indice a franchi la résistance à environ 7600 points. Une poursuite de la hausse est donc indiquée, et il y a maintenant un support à 7600 points en cas de corrections. L'indice est généralement considéré comme positif technique pour moyen long terme.
OMX Stockholm PI
arrow green   Candidat positif intéressant
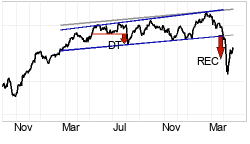
OMX Stockholm PI fluctue dans un canal haussier et une progression poursuivant le canal haussier est indiquée. En cas de corrections à la baisse il y a du support en bas du canal haussier. En plus une formation rectangulaire a donné un signal d'achat suite au franchissement à la hausse de la résistance à 1129. Une poursuite de la hausse jusqu'à 1181 ou plus est indiquée. L'indice a franchi la résistance à environ 1117 points. Une poursuite de la hausse est donc indiquée, et il y a maintenant un support à 1117 points en cas de corrections. L'indice est généralement considéré comme positif technique pour moyen long terme.
Cas du jour
Danske Bank (DANSKE) Cours 374.40, 4. sep 2026
chart
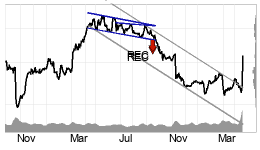
Danske Bank fluctue dans un canal haussier. Un développement positif poursuivant le canal haussier est indiqué. En plus, la valeur a franchi un niveau de résistance sur le court terme et la stratégie de trading range court terme a donné un signal d'achat. L'action a marginalement franchi la résistance à environ 374 kroner. Un franchissement établi et persistant peut indiquer une poursuite de la hausse. L'action est généralement considéré comme positif technique pour moyen long terme.
Recommendation: Positif
Index du jour précédent
AEX0.80%1113.50
CAC40-0.09%8278.77
COMPX-0.29%26506.99
DAX0.17%26046
HEX0.87%13688.33
N1000.19%1910.53
OMXC25GI-0.20%2334.67
OMXSPI0.16%1140.85
OSEBX-0.10%2103.63
PSI20-0.14%9388.77
TECDAX-0.12%4022.75
BUK100P0.01%1076.62
EURUSD-0.12%1.1622
CL (OIL)0.20%91.48
Estimations d'index
 CML
AEXpospospos
CAC40neutralpospos
COMPXnegpospos
DAXneutralpospos
HEXposneutralpos
N100negpospos
OMXC25GIposposneutral
OMXSPIpospospos
OSEBXneutralpospos
PSI20pospospos
TECDAXpospospos
BUK100Ppospospos
EURUSDposnegpos
CL (OIL)neutralposneutral

C: Court terme.    M: Moyen terme.    L: Long terme .
Baromètre de bourse
Københavns Fondsbørs - Moyen terme
 
      
44% 40% 16%
 77 Candidats positifs intéressants
 70 A surveiller
 27 Candidats négatifs intéressants
Track what the insiders are doing! Insider buys in green, insider sales in red.
 
   Mois dernier:
   65% Positif
   28 Positif
   15 Négatif
Conditions générales d'utilisation et avis de précaution Copyright © 2026 Investtech.com AS, Org nr 978 655 424 MVA


Investtech guarantees neither the entirety nor accuracy of the analyses. Any consequent exposure related to the advice / signals which emerge in the analyses is completely and entirely at the investors own expense and risk. Investtech is not responsible for any loss, either directly or indirectly, which arises as a result of the use of Investtechs analyses. Details of any arising conflicts of interest will always appear in the investment recommendations. Further information about Investtechs analyses can be found here disclaimer. The content provided by Investtech.com is NOT SEC or FSA regulated and is therefore not intended for US or UK consumers.

Cancel Analysis News
[ Back to default newsletter setup ]

Edit AnalysisNews

Register as a recipient of AnalysisNews in order to customise the content.


Investtech guarantees neither the entirety nor accuracy of the analyses. Any consequent exposure related to the advice / signals which emerge in the analyses is completely and entirely at the investors own expense and risk. Investtech is not responsible for any loss, either directly or indirectly, which arises as a result of the use of Investtechs analyses. Details of any arising conflicts of interest will always appear in the investment recommendations. Further information about Investtechs analyses can be found here disclaimer. The content provided by Investtech.com is NOT SEC or FSA regulated and is therefore not intended for US or UK consumers.


Investtech guarantees neither the entirety nor accuracy of the analyses. Any consequent exposure related to the advice / signals which emerge in the analyses is completely and entirely at the investors own expense and risk. Investtech is not responsible for any loss, either directly or indirectly, which arises as a result of the use of Investtechs analyses. Details of any arising conflicts of interest will always appear in the investment recommendations. Further information about Investtechs analyses can be found here disclaimer. The content provided by Investtech.com is NOT SEC or FSA regulated and is therefore not intended for US or UK consumers.

Titlex

OK
+

Samtykke

Vi bruger cookies for at give dig en bedre brugeroplevelse. Hvis du fortsætter med at bruge hjemmesiden, accepterer du dette. For yderligere detaljer klik her.