
 Oslo Børs
 Stockholmsbörsen
 Københavns Fondsbørs
Investeringsforeninger
Københavns Fondsbørs
Investeringsforeninger
 Helsingin pörssi
 World Indices
 US Stocks
US 30
Nasdaq 100
US 500
US Stocks
US 30
Nasdaq 100
US 500
 Toronto Stock Exchange
 London Stock Exchange
 Euronext Amsterdam
 Euronext Brussel
 DAX
SDAX
TECDAX
Frankfurt
CDAX
MDAX
Prime Standard
DAX
SDAX
TECDAX
Frankfurt
CDAX
MDAX
Prime Standard
 CAC 40
 Mumbai S.E.
National S.E.
Mumbai S.E.
National S.E.
 Commodities
 Currency
 Cryptocurrency
 Exchange Traded Funds
 Investtech Indices
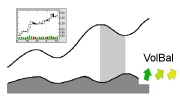
Volume balance
Volume balance measures how aggressive the investors are on increasing and decreasing prices. It can give the following answers:
- Investors are now so aggressive that they push the price upwards to buy into the stock.
- Investors are now so pessimistic that they push the price downwards to get rid of their stocks.
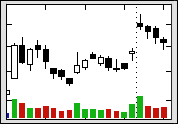
 High volume on increasing prices indicates that optimism is increasing and many investors pay more to secure stocks. Low volume on falling prices indicates that few investors will reduce the price to secure a sell and that they are comfortable keeping the stock. This is positive, and mirrored in a high volume balance.
The green columns show volume on days with increasing prices, while the red show volume on days with falling prices. High green columns and low red ones give positive volume balance.
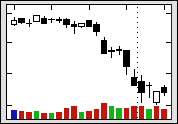
 High volume on falling prices indicates increasing uncertainty and that many investors reduce the price to get rid of their stocks. Low volume on rising prices indicates that few investors are willing to pay more to be able to buy, and they are not very interested or assume they can buy at a lower price later. This is negative, and mirrored in a low volume balance.
Please note the high red volume columns in the chart to the left, combined with the low green ones. We see this already in the first half of the chart. Volume balance was negative and signaled the coming price decrease.
Positive volume balance strengthens buy signals from other indicators, while negative volume balance strengthens sell signals. Likewise, positive volume balance will strengthen or confirm a rising trend, whereas negative volume balance will confirm a falling trend. As shown above, volume balance also often warns of coming price movements.
In Investtechs charts, volume balance is shown as three arrows in the bottom right hand corner of the charts. The first arrow is calculated based on the trading in the past week, the second for the past month and the third one for the past quarter. Especially the weekly indicator is susceptible to noise and should be used with care. At the same time, it can be the best indicator when looking for very short term investment opportunities.
Calculating volume balance
Volume balance is basically the correlation between price change and volume. The indicator is calculated for 5, 22 and 66 days, corresponding to a week, a month and a quarter respectively.
The indicator has values between 100 for maximally negative and +100 for maximally positive. The exact values are shown in the table in the chart pages, and visualized by arrows in the bottom right hand corner of the charts. Green arrows pointing upwards show that volume balance is positive and red arrows pointing downwards show that volume balance is negative. Yellow sideways arrows show neutral volume balance.
Investtech guarantees neither the entirety nor accuracy of the analyses. Any consequent exposure related to the advice / signals which emerge in the analyses is completely and entirely at the investors own expense and risk. Investtech is not responsible for any loss, either directly or indirectly, which arises as a result of the use of Investtechs analyses. Details of any arising conflicts of interest will always appear in the investment recommendations. Further information about Investtechs analyses can be found here disclaimer.
The content provided by Investtech.com is NOT SEC or FSA regulated and is therefore not intended for US or UK consumers.
Copyright Ⓒ 1997-2024 Investtech.com AS, Org nr 978 655 424 MVA Privacy Policy | Conditions générales d'utilisation et avis de précaution
Head office
Strandveien 171366 Lysaker, Norway
Research department
Instituttveien 102007 Kjeller, Norway