Momentum and RSI
RSI is an often used indicator in technical analysis. RSI means Relative Strength Index, and it measures how well a stock has performed compared to itself. The figure is calculated by looking at the strength of days with rising prices compared to strength of days with falling prices over a certain period of time and it gets a value between 0 and 100.
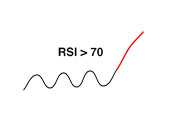
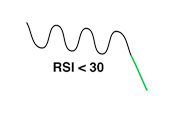
A stock that has risen a lot compared to reactions back during this time, will have high RSI. Similarly a stock that has fallen a lot compared to reactions back, will have low RSI. RSI is used as an indicator of whether a stock is oversold or overbought, and if it has positive momentum or negative momentum.
RSI can indicate that:
- This stock has risen a lot in a short time. Optimism is increasing and further rise is indicated.
- This stock has fallen a lot in a short time. The investors are becoming more pessimistic and will continue to reduce prices to get out of the stock.
Many investors also think that RSI indicates whether a stock has risen or fallen too much and will react back. Investtech’s research shows that this overbought and oversold interpretation is statistically not true.
Read the research report on RSI here.
RSI as overbought/oversold indicator
A stock is overbought when it has risen a lot in a short time, without any significant reactions back during the time period. The idea is that it has risen too much and will have a reaction back soon, indicating that it is time to sell the stock. Similarly a stock is oversold when it has fallen a lot in a short time. This may indicate that it will have a reaction up soon and should be bought before then. See example below.
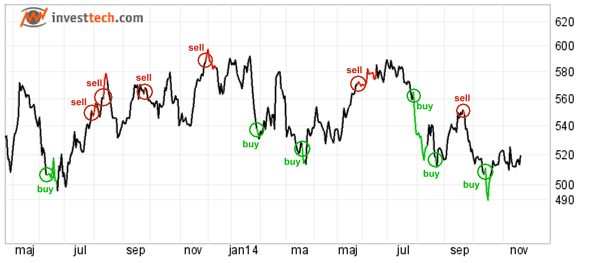

Figure 1: RSI21 in Carlsberg B. Green areas show oversold RSI (below 30) and red areas overbought RSI (above 70).
RSI as momentum indicator
RSI is also used as a momentum indicator. The idea is that major price movements indicate that the investors as a group are in motion. It is thought necessary to join the early movements, as even more investors will join later and drive the price further in the same direction. See example below.
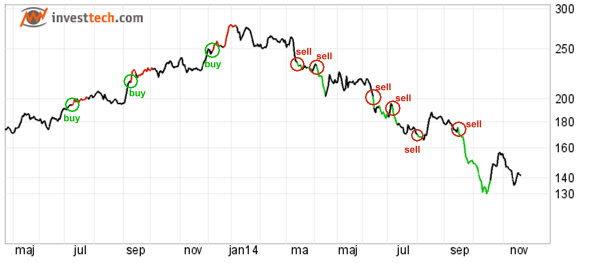

Figure 2: RSI21 in D/S Norden. Red areas show high momentum and positive (RSI above 70) and green areas show high momentum and negative (RSI below 30).
Investtech guarantees neither the entirety nor accuracy of the analyses. Any consequent exposure related to the advice / signals which emerge in the analyses is completely and entirely at the investors own expense and risk. Investtech is not responsible for any loss, either directly or indirectly, which arises as a result of the use of Investtechs analyses. Details of any arising conflicts of interest will always appear in the investment recommendations. Further information about Investtechs analyses can be found here disclaimer.
The content provided by Investtech.com is NOT SEC or FSA regulated and is therefore not intended for US or UK consumers.


 Oslo Børs
 Stockholmsbörsen
 Københavns Fondsbørs
 Helsingin pörssi
 World Indices
 US Stocks
 Toronto Stock Exchange
 London Stock Exchange
 Euronext Amsterdam
 Euronext Brussel
 DAX
DAX CAC 40
 Mumbai S.E.
 Commodities
 Currency
 Cryptocurrency
 Exchange Traded Funds
 Investtech Indices