
 Oslo Børs
 Stockholmsbörsen
 Københavns Fondsbørs
Investeringsforeninger
Københavns Fondsbørs
Investeringsforeninger
 Helsingin pörssi
 World Indices
 US Stocks
US 30
Nasdaq 100
US 500
US Stocks
US 30
Nasdaq 100
US 500
 Toronto Stock Exchange
 London Stock Exchange
 Euronext Amsterdam
 Euronext Brussel
 DAX
SDAX
TECDAX
Frankfurt
CDAX
MDAX
Prime Standard
DAX
SDAX
TECDAX
Frankfurt
CDAX
MDAX
Prime Standard
 CAC 40
 Mumbai S.E.
National S.E.
Mumbai S.E.
National S.E.
 Commodities
 Currency
 Cryptocurrency
 Exchange Traded Funds
 Investtech Indices
Banking stocks look positive
Published November 6, 2018
Webinar November 14
Join our free online webinar on November 14 . Analyst Kiran Shroff and Country Manager Jan Marius van Leeuwen will give an introduction to Investtech's analyses and present stock picking tools & strategies.
The market showed a small loss Monday, and Nifty 50 (NIFTY) ended the day at 10524 points, which is a decline of 0.27 per cent.
713 shares were up and 782 were down, while 59 remained unchanged. There was no trading in 251 shares.
The total value of the trading volume for shares and primary capital certificates Monday was approximately 292.4 billion.
Nifty Bank (BANKNIFTY.NS) Close: 25 732.00
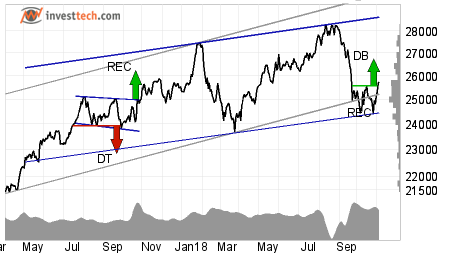 Bank Nifty was the star performer among all the indices on NSE with Nifty PSU Bank index rising around 2.90 per cent on Monday.
The index is still inside an uptrend channel, unlike Nifty 50. It marginally broke above its resistance at 25700 points and also gave a breakout from a small double double bottom formation. This is a positive sign. However, there is still a long way to go as the next level of resistance is shown at 27500 points or a little less than 7 per cent from yesterday's close. Support is around 24400 points in BankNifty.
Investtech's outlook (one to six months): Positive
Axis Bank Limited (AXISBANK.NS) Close: 624.40
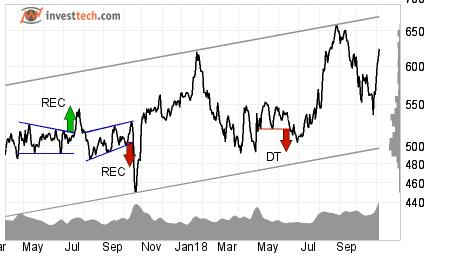 Since our last published analysis of AXISBANK on the 17th of October, the stock has gained over 12 per cent.
AXISBANK rose over two per cent on Monday on very high volumes.
The stock is looking strong in a rising trend channel in the medium term. It broke through its earlier resistance of 620.00 rupees to close at 624.40 rupees. Next resistance is nowhere before 660.00 which is its last pivot point. On the downside there is support around 590.00 levels.
The volume balance indicator is positive and suggests that more investors are buying in the the stock at steadily higher prices while sellers are not willing to sell at lower prices. The momentum indicator RSI is also positive and rising, which supports the price rise.
Investtech's outlook (one to six months): Positive
Oriental Bank of Comme (ORIENTBANK.NS) Close: 82.05
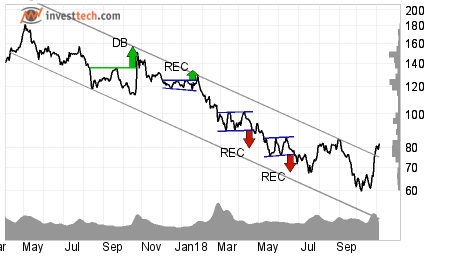 Another interesting-looking banking stock is Orient Bank of Commerce. The stock is out of its downward trend channel and is just 3.6 % shy of giving a buy signal. It is trading under its resistance of 85.00 rupees. A close above this level may initiate a buy signal in the stock.
Volume balance is positive as indicated by green up arrows on the bottom right corner of the chart, indicating that buyers are getting aggressive while sellers are passive. This is a sign of strength. RSI above 70 shows that the stock has strong positive momentum in the short term.
The stock has short term support around 76.70.
Investtech's outlook (one to six months): Watch
Other interesting-looking banking stocks that are very close to their short term resistance levels and have very positive volume balance, and thus can turn out to be good bets in the near term if they manage to close above their resistance levels, are SOUTHBANK, UNIONBANK, FEDERALBANK and SYNDIBANK.
The analyses are based on closing price as per November 5, 2018. Maintaining proper stop loss is always recommended.
Written by

Analyst - Investtech
Archive:
02 November: Positive on this one
01 November: TECHM, NIFTY50 and Hausse
31 October: What are investors thinking?
30 October: Bullish on these three stocks
26 October: Three potential candidates to ride on
24 October: Three big Metal stocks, Seasonal variation
22 October: Among top performers on our Top 50 list
18 October: Three stocks investors should stay away from
17 October: Flowing against the tide
16 October: Positive on these 2 stocks
11 October: Over 45 per cent rise
9 October: The Indian banking space
5 October: Nifty closes at a crucial level
2 October: Price formations in the long-term charts
28 September: Positive on Biocon Limited
"Investtech analyses the psychology of the market and gives concrete trading suggestions every day."

Partner & Senior Advisor - Investtech


Investtech guarantees neither the entirety nor accuracy of the analyses. Any consequent exposure related to the advice / signals which emerge in the analyses is completely and entirely at the investors own expense and risk. Investtech is not responsible for any loss, either directly or indirectly, which arises as a result of the use of Investtechs analyses. Details of any arising conflicts of interest will always appear in the investment recommendations. Further information about Investtechs analyses can be found here disclaimer.
The content provided by Investtech.com is NOT SEC or FSA regulated and is therefore not intended for US or UK consumers.
Head office
Strandveien 171366 Lysaker, Norway
Research department
Instituttveien 102007 Kjeller, Norway