
 Oslo Børs
 Stockholmsbörsen
 Københavns Fondsbørs
Investeringsforeninger
Københavns Fondsbørs
Investeringsforeninger
 Helsingin pörssi
 World Indices
 US Stocks
US 30
Nasdaq 100
US 500
US Stocks
US 30
Nasdaq 100
US 500
 Toronto Stock Exchange
 London Stock Exchange
 Euronext Amsterdam
 Euronext Brussel
 DAX
SDAX
TECDAX
Frankfurt
CDAX
MDAX
Prime Standard
DAX
SDAX
TECDAX
Frankfurt
CDAX
MDAX
Prime Standard
 CAC 40
 Mumbai S.E.
National S.E.
Mumbai S.E.
National S.E.
 Commodities
 Currency
 Cryptocurrency
 Exchange Traded Funds
 Investtech Indices
Solid buy signal
Published November 14, 2018
Webinar today
Join our free online webinar today. Analyst Kiran Shroff and Country Manager Jan Marius van Leeuwen will give an introduction to Investtech's analyses and present stock picking tools & strategies.
Nifty 50 (NIFTY) showed positive development on Tuesday, and gained 0.96 per cent to a close of 10583 points.
743 shares were up and 758 were down, while 59 remained unchanged, and there was no trading in 244 shares.
The value of the total volume of shares and primary capital certificates traded Tuesday was approximately 272.0 billion.
We are keeping it short and simple today. Writing analysis of only one stock, but this one has given a solid buy signal both in the medium and the long term. 63 Moons Technologies it is.
63 Moons Technologies (63MOONS.NS) Close: 89.20
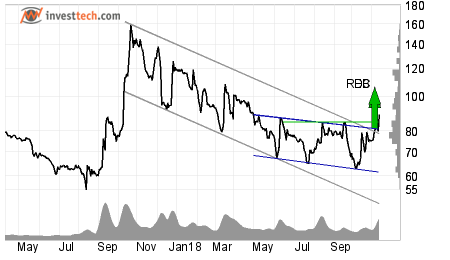
The sectoral index Nifty IT component 63 Moons Technologies stock has risen from the ashes in the past few weeks. Since its fall from the top a year ago, the stock went into a sideways move for the last six months.
Yesterday the share price of 63MOONS rose almost 10 per cent. It has now broken out through the ceiling of the downtrend channel and also generated a buy signal from a double bottom and a rectangle formation while rising above its resistance of 85 rupees.
This price breakout was accompanied by higher than average volumes on a weekly and monthly basis.
The volume balance indicator is very positive and suggests that more investors are buying in the the stock at steadily higher prices, while sellers are not willing to sell at lower prices. The momentum indicator RSI is also positive and RSI is above 70 after a good price increase in the past few weeks. The stock has strong positive momentum and further increase in price is indicated.
Two points to note at this stage. One is that the price must be able to sustain closer to the existing levels, and another is that the volatility in the stock is as high as 30 percent monthly average. So the price swings can be a bit tricky, but all prices should be assessed on the closing basis.
The stock is overall assessed as technically positive for the medium long term.
Investtech's outlook (one to six months): Positive
The analyses are based on closing price as per November 13, 2018. Maintaining proper stop loss is always recommended.
Written by

Analyst - Investtech
Archive:
13 November: Big auto stocks comparison
09 November: What to wait for?
06 November: Banking stocks look positive
02 November: Positive on this one
01 November: TECHM, NIFTY50 and Hausse
31 October: What are investors thinking?
30 October: Bullish on these three stocks
26 October: Three potential candidates to ride on
24 October: Three big Metal stocks, Seasonal variation
22 October: Among top performers on our Top 50 list
18 October: Three stocks investors should stay away from
17 October: Flowing against the tide
16 October: Positive on these 2 stocks
11 October: Over 45 per cent rise
9 October: The Indian banking space
5 October: Nifty closes at a crucial level
2 October: Price formations in the long-term charts
28 September: Positive on Biocon Limited
"Investtech analyses the psychology of the market and gives concrete trading suggestions every day."

Partner & Senior Advisor - Investtech


Investtech guarantees neither the entirety nor accuracy of the analyses. Any consequent exposure related to the advice / signals which emerge in the analyses is completely and entirely at the investors own expense and risk. Investtech is not responsible for any loss, either directly or indirectly, which arises as a result of the use of Investtechs analyses. Details of any arising conflicts of interest will always appear in the investment recommendations. Further information about Investtechs analyses can be found here disclaimer.
The content provided by Investtech.com is NOT SEC or FSA regulated and is therefore not intended for US or UK consumers.
Head office
Strandveien 171366 Lysaker, Norway
Research department
Instituttveien 102007 Kjeller, Norway