
 Oslo Børs
 Stockholmsbörsen
 Københavns Fondsbørs
Investeringsforeninger
Københavns Fondsbørs
Investeringsforeninger
 Helsingin pörssi
 World Indices
 US Stocks
US 30
Nasdaq 100
US 500
US Stocks
US 30
Nasdaq 100
US 500
 Toronto Stock Exchange
 London Stock Exchange
 Euronext Amsterdam
 Euronext Brussel
 DAX
SDAX
TECDAX
Frankfurt
CDAX
MDAX
Prime Standard
DAX
SDAX
TECDAX
Frankfurt
CDAX
MDAX
Prime Standard
 CAC 40
 Mumbai S.E.
National S.E.
Mumbai S.E.
National S.E.
 Commodities
 Currency
 Cryptocurrency
 Exchange Traded Funds
 Investtech Indices
S&P 500 (SP500.US500)
Close: 5 022.21 (-29.20), Apr 17, 2024
Hold
Low risk
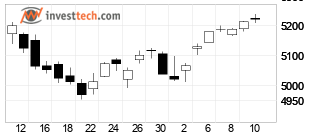
Candlesticks
Short term: Negative
Medium term: Hold
Long term: Positive
Short term
S&P 500 has broken the floor of the rising trend channel in the short term, which indicates a weaker initial rising rate. The index has broken down through support at points 5070. This predicts a further decline. In case of positive reactions, there will now be resistance at points 5070. The short term momentum of the index is strongly negative, with RSI below 30. This indicates increasing pessimism among investors and further decline for S&P 500. However, particularly in big stocks, low RSI may be a sign that the stock is oversold and that there is a chance for a reaction upwards. The RSI curve shows a falling trend, which could be an early signal of the start of a falling trend for the price as well. The index is overall assessed as technically negative for the short term.Recommendation one to six weeks: Negative (Score: -54)
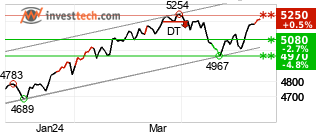
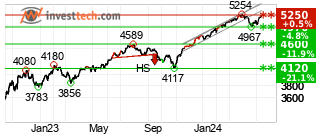
Medium term
S&P 500 has broken the floor of the rising trend channel in the medium long term, which indicates a weaker initial rising rate. The index has broken a support level in the short term and given a negative signal for the short term trading range. The index has support at points 4600 and resistance at points 5250. The RSI curve shows a falling trend, which could be an early signal of the start of a falling trend for the price as well. The index is overall assessed as technically neutral for the medium long term.Recommendation one to six months: Hold (Score: 21)
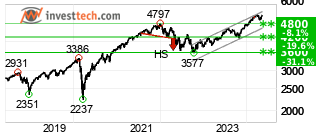
Long term
Investors have paid higher prices over time to buy S&P 500 and the index is in a rising trend channel in the long term. This signals increasing optimism among investors and indicates continued rise. The index is approaching support at 4800 points, which may give a positive reaction. However, a break downwards through 4800 points will be a negative signal. The index is assessed as technically positive for the long term.Recommendation one to six quarters: Positive (Score: 65)
Overall analysis
S&P 500 is technically negative for the short term, neutral for the medium term, and positive for the long term.Recommendation one to six months: Hold (Score: 19)
Investtech guarantees neither the entirety nor accuracy of the analyses. Any consequent exposure related to the advice / signals which emerge in the analyses is completely and entirely at the investors own expense and risk. Investtech is not responsible for any loss, either directly or indirectly, which arises as a result of the use of Investtechs analyses. Details of any arising conflicts of interest will always appear in the investment recommendations. Further information about Investtechs analyses can be found here disclaimer.
The content provided by Investtech.com is NOT SEC or FSA regulated and is therefore not intended for US or UK consumers.
Head office
Strandveien 171366 Lysaker, Norway
Research department
Instituttveien 102007 Kjeller, Norway
×
