
 Oslo Børs
 Stockholmsbörsen
 Københavns Fondsbørs
Investeringsforeninger
Københavns Fondsbørs
Investeringsforeninger
 Helsingin pörssi
 World Indices
 US Stocks
US 30
Nasdaq 100
US 500
US Stocks
US 30
Nasdaq 100
US 500
 Toronto Stock Exchange
 London Stock Exchange
 Euronext Amsterdam
 Euronext Brussel
 DAX
SDAX
TECDAX
Frankfurt
CDAX
MDAX
Prime Standard
DAX
SDAX
TECDAX
Frankfurt
CDAX
MDAX
Prime Standard
 CAC 40
 Mumbai S.E.
National S.E.
Mumbai S.E.
National S.E.
 Commodities
 Currency
 Cryptocurrency
 Exchange Traded Funds
 Investtech Indices
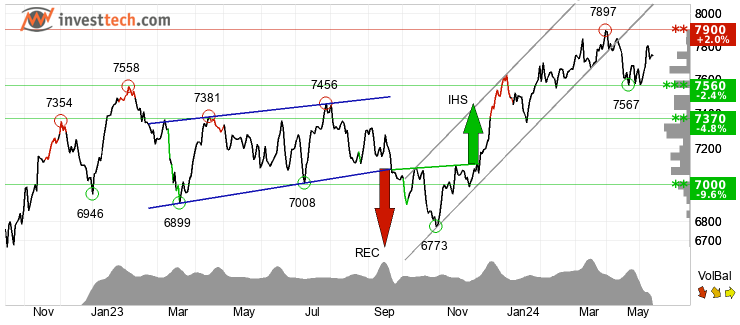
S&P 200 (AXJO.NDX)
Close: 7 567.30 (-74.80), Apr 19, 2024
Weak Positive

Overall analysis
S&P 200 is technically neutral for the short and long term, but positive for the medium term.Recommendation one to six months: Weak Positive
Short term
S&P 200 has broken the rising trend channel in the short term and reacted strongly down. For the time being, it is difficult to say anything about the future trend direction. The index is testing support at points 7550. This could give a positive reaction, but a downward breakthrough of points 7550 means a negative signal. RSI is below 30 after the falling prices of the past weeks. The index has strong negative momentum and further decline is indicated. However, particularly in big stocks, low RSI may be a sign that the stock is oversold and that there is a chance for a reaction upwards. The index is overall assessed as technically neutral for the short term.Recommendation one to six weeks: Hold
Medium term
S&P 200 has broken through the floor of a rising trend channel in the medium long term. This indicates a slower rising rate at first, or the start of a more horizontal development. The index is testing support at points 7560. This could give a positive reaction, but a downward breakthrough of points 7560 means a negative signal. The RSI curve shows a falling trend, which could be an early signal of the start of a falling trend for the price as well. The index is overall assessed as technically slightly positive for the medium long term.Recommendation one to six months: Weak Positive
Long term
S&P 200 is within an approximate horizontal trend channel in the long term, which indicates further development in the same direction. The index has given a positive signal from the rectangle formation by a break up through the resistance at 7372. Further rise to 8050 or more is signaled. The index has marginally broken down through support at points 7600. An established break predicts a further decline. The index is overall assessed as technically neutral for the long term.Recommendation one to six quarters: Hold
Investtech guarantees neither the entirety nor accuracy of the analyses. Any consequent exposure related to the advice / signals which emerge in the analyses is completely and entirely at the investors own expense and risk. Investtech is not responsible for any loss, either directly or indirectly, which arises as a result of the use of Investtechs analyses. Details of any arising conflicts of interest will always appear in the investment recommendations. Further information about Investtechs analyses can be found here disclaimer.
The content provided by Investtech.com is NOT SEC or FSA regulated and is therefore not intended for US or UK consumers.
Head office
Strandveien 171366 Lysaker, Norway
Research department
Instituttveien 102007 Kjeller, Norway
×
