
 Oslo Børs
 Stockholmsbörsen
 Københavns Fondsbørs
Investeringsforeninger
Københavns Fondsbørs
Investeringsforeninger
 Helsingin pörssi
 World Indices
 US Stocks
US 30
Nasdaq 100
US 500
US Stocks
US 30
Nasdaq 100
US 500
 Toronto Stock Exchange
 London Stock Exchange
 Euronext Amsterdam
 Euronext Brussel
 DAX
SDAX
TECDAX
Frankfurt
CDAX
MDAX
Prime Standard
DAX
SDAX
TECDAX
Frankfurt
CDAX
MDAX
Prime Standard
 CAC 40
 Mumbai S.E.
National S.E.
Mumbai S.E.
National S.E.
 Commodities
 Currency
 Cryptocurrency
 Exchange Traded Funds
 Investtech Indices
The Trend Bible
 Tel: +47 21 555 888
 E-mail us
 Request a call
 Visit us
Investtechs research results largely confirm established technical analysis theory which says that rising trends will continue to rise. Nine of the twelve different signal categories have given excess return following buy signals, and ten of the twelve have given negative excess return following sell signals.
Trends Research Results Summary
We have studied 350.297 signals from trends in stocks on the Nordic Stock Exchanges in the period 1996 to 2015. The signals were identified by Investtechs automated algorithms for all stocks listed in the period with a turnover of at least half a million krone per day on average. These are the same algorithms a used in the daily analyses in Investtechs subscription service.
The goal was to see how stocks with different trend signals develop in the coming months and whether this strengthened or weakened established technical analysis theory and whether it could be used to define good investment strategies.
We have mainly studied price development 66 days i.e. 3 months, after identified signals. We have looked at stocks within trend channels and breaks upwards and downwards from trend channels. We have studied three time perspectives where short term is trends in Investtechs short term price charts, which cover some six months, medium long term is 168 months long price charts and long term is 6-year price charts.
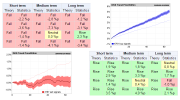
The results are presented in the table below. Empirical refers to empirical data, i.e. what we observed on the Nordic stock exchanges in the period, and percentage is the weighted average of the four Exchanges.
Absolute figures, buy signals
| Short term | Medium long term | Long term | ||||
| Signal type | Theory | Empirical | Theory | Empirical | Theory | Empirical |
| Within rising trend | Increase | Increase 5.4 % |
Increase | Increase 5.3 % |
Increase | Increase 4.3 % |
| Breaking upwards through ceiling of rising trend | Increase | Increase 6.4 % |
Increase | Increase 6.9 % |
Increase | Increase 5.2 % |
| Breaking downwards through floor of rising trend | Increase | Increase 4.9 % |
Increase | Increase 4.0 % |
Increase | Increase 2.5 % |
| Breaking upwards through ceiling of sideways trend | Increase | Increase 7.0 % |
Increase | Increase 7.5 % |
Increase | Increase 5.6 % |
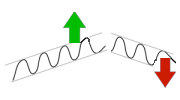
All twelve signal categories have given positive excess return following buy signals. Our studies strengthen the technical analysis theory that stocks in rising trends, and with breaks upwards from rising trends, will continue to rise.
Stocks breaking upwards through the ceiling of rising trends have risen more than stocks in rising trends, which have risen more than stocks breaking downwards from rising trend. This is well in line with technical analysis theory. Stocks breaking upwards from sideways trends make up the signal category with the very best return in the following three months
Short and medium long term signals made the best predictions, but the long term buy signals were also followed by significant price increase.
Absolute figures, sell signals
| Short term | Medium long term | Long term | ||||
| Signal type | Theory | Empirical | Theory | Empirical | Theory | Empirical |
| Within falling trend | Decrease | Neutral 1.3 % |
Decrease | Neutral 0.7 % |
Decrease | Increase 2.4 % |
| Breaking downwards through floor of falling trend | Decrease | Neutral -0.1 % |
Decrease | Decrease -3.8 % |
Decrease | Neutral 0.5 % |
| Breaking upwards through ceiling of falling trend | Decrease | Increase 2.1 % |
Decrease | Increase 3.5 % |
Decrease | Increase 5.8 % |
| Breaking downwards through floor of sideways trend | Decrease | Increase 2.1 % |
Decrease | Neutral -0.6 % |
Decrease | Neutral 0.1 % |
Neutral: Between -2 and +2 per cent in three months.
Only one of the twelve signal categories have given significant negative return in the following period, namely break downwards through the floor of medium long term falling trend. There are five categories with sell signals that have given significant positive return and six that have given neutral return. Strictly speaking we have refuted the technical analysis theory which says that stocks in falling trends will continue to fall. However, the relative figures below will show that the theory is not all wrong.
The table shows that stocks with breaks downwards through the floor of falling trends have done worse than stocks within falling trends which have done worse than stocks with breaks upwards through the ceiling of falling trends. This is in agreement with established theory.
Short and medium long term gave the best prediction here as well. Sell signals from long term trends all gave average price increase in the first three months.
Relative figures, buy signals
Many investors focus on relative return. The reason is often that it is better to be on the stock exchange regardless, so what matters is whether or not the stocks you own outperform benchmark. The table below shows relative price development compared to benchmark 66 days after various buy signals for different time perspectives.
| Short term | Medium long term | Long term | ||||
| Signal type | Theory | Empirical | Theory | Empirical | Theory | Empirical |
| Within rising trend | Increase | Increase 1.9 ppt |
Increase | Increase 1.8 ppt |
Increase | Neutral 0.8 ppt |
| Breaking upwards through the ceiling of rising trend | Increase | Increase 2.9 ppt |
Increase | Increase 3.3 ppt |
Increase | Increase 1.7 ppt |
| Breaking downwards through the floor of rising trend | Increase | Increase 1.4 ppt |
Increase | Neutral 0.4 ppt |
Increase | Decrease -1.0 ppt |
| Breaking upwards through the ceiling of sideways trend | Increase | Increase 3.5 ppt |
Increase | 4.0 ppt | Increase | Increase 2.1 ppt |
ppt: percentage points
Neutral: Between -1 and +1 percentage point deviation from benchmark in three months
Nine of the twelve different signal categories gave positive excess return following buy signals. Not only did buy signals from trends give positive return, they gave return significantly better than index the following months.
As is the case for the absolute figures, stocks with breaks upwards through the ceiling of rising trends have risen more than stocks in rising trends, which have risen more than stocks breaking downwards from rising trend.
Short and medium long term signals made the best predictions, and the long term buy signals were also followed by price increase when the stock was in a rising trend or had broken upwards.
Only buy signal from break downwards from long term rising trend have given relative negative excess return in the next three months. A downwards break like this will often be followed by a trend reversal into a falling trend in the short or medium long term. Short term signals are indicated to have stronger predictive power than long term, so the negative excess return in this case is not surprising.
Relative figures, sell signals
The table below shows relative price development compared to benchmark 66 days after various sell signals from trends for different time perspectives.
| Short term | Medium long term | Long term | ||||
| Signal type | Theory | Empirical | Theory | Empirical | Theory | Empirical |
| Within falling trend | Decrease | Decrease -2.2 ppt |
Decrease | Decrease -2.8 ppt |
Decrease | Decrease -1.2 ppt |
| Breaking downwards through the floor of falling trend | Decrease | Decrease -3.6 ppt |
Decrease | Decrease -7.3 ppt |
Decrease | Decrease -3.1 ppt |
| Breaking upwards through the ceiling of falling trend | Decrease | Decrease -1.4 ppt |
Decrease | Neutral 0.0 ppt |
Decrease | Increase 2.3 ppt |
| Breaking downwards through the floor of sideways trend | Decrease | Decrease -1.4 ppt |
Decrease | Decrease -4.1 ppt |
Decrease | Decrease -3.4 ppt |
ppt: percentage points
Neutral: Between -1 and +1 percentage point deviation from benchmark in three months.
Nine of twelve different signal categories have given negative excess return following sell signals. Even though the stocks with sell signals in general have risen somewhat, most of them have been outperformed by benchmark in the following months.
As is the case for the absolute figures, stocks with break downwards through the floor of falling trends have done worse than stocks within falling trends which have done worse than stocks with breaks upwards through the ceiling of falling trends.
Short and medium long term gave the best prediction, and the long term sell signals were also followed by relative price decrease when the stock was in a falling trend or had broken downwards.
Only sell signal from break upwards from long term falling trend has given relative excess return in the next three months. This break upwards will often be followed by a trend reversal to rising trend in the short or medium long term. Short term signals are indicated to have stronger predictive power than long term, so the excess return in this case is not surprising.
Conclusion
We have studied 350.297 signals from trends in stocks on the Nordic Stock Exchanges in the period 1996 to 2015. The signals were identified by Investtechs automated algorithms for all stocks listed in the period that had a minimum average daily turnover of half a million krone. These are the same algorithms used in the daily analyses in Investtechs subscription services.
The results largely confirm established technical analysis theory that stocks in rising trends will continue to rise. Statistically they also outperform index.
Compared to benchmark the results are as significant for falling trends; stocks in falling trends continue to underperform compared to index. However, in absolute figures these sell signals gave a statistical price increase in the next three months.
The results are stronger for trend signals in Investtechs short and medium long term price charts. Results are stronger for stocks with daily average turnover below five million kroner, especially for buy signals.
The data set is large and the base data considered good. According to statistical measures of quality the results are clearly significant with T-values for many of the calculations between five and ten.
Even though the data gave significant results, we have no guarantee that the same conditions will repeat themselves. On the other hand, there is no reason to believe that the psychological aspects of human behaviour in the stock market will change significantly over time. We have to expect a certain amount of quantitative and algorithm based trading, also for more long term investment, so the effects may diminish over time. However we will not escape the human aspect.
Most well functioning stock markets are influenced by the same mechanisms as the Nordic ones. Particularly the psychological drivers, with greed and fear as central factors, as assumed to be the same for investors worldwide. Thus there is no reason to assume that the overall conclusions will not be valid also for other markets.
Investtech's reference work based on studies of more than 350,000 signals from trends in stocks listed on
the Nordic stock exchanges from 1996 to 2015.
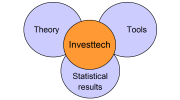
Practical use - Tools - Statistics - Algorithms - Theory.
The Trend Bible - Start Page More on Investtech's research

The Trend Bible was written in 2016 by Investtechs Head of Research Mr. Geir Linløkken. The research team behind the Trend Bible also consists of Senior Researchers Asbjørn Taugbøl and Fredrik Tyvand.
Investtech has worked on research into behavioural finance and technical and quantitative stock analysis since 1997. The company has developed an analysis system that identifies trends, support and resistance, formations and volume patterns in stock prices, and uses these to generate buy and sell signals. Investtech uses advanced mathematical algorithms and statistical methods in computer programmes and online subscription services.
Investtech guarantees neither the entirety nor accuracy of the analyses. Any consequent exposure related to the advice / signals which emerge in the analyses is completely and entirely at the investors own expense and risk. Investtech is not responsible for any loss, either directly or indirectly, which arises as a result of the use of Investtechs analyses. Details of any arising conflicts of interest will always appear in the investment recommendations. Further information about Investtechs analyses can be found here disclaimer.
The content provided by Investtech.com is NOT SEC or FSA regulated and is therefore not intended for US or UK consumers.
Head office
Strandveien 171366 Lysaker, Norway
Research department
Instituttveien 102007 Kjeller, Norway